Exploring the spatial patterns of Gaussian Path Sampling
File labeling structure
{site_name}_{depth|disch}_{resolution}_{particle density}_{seed}
Mean Value
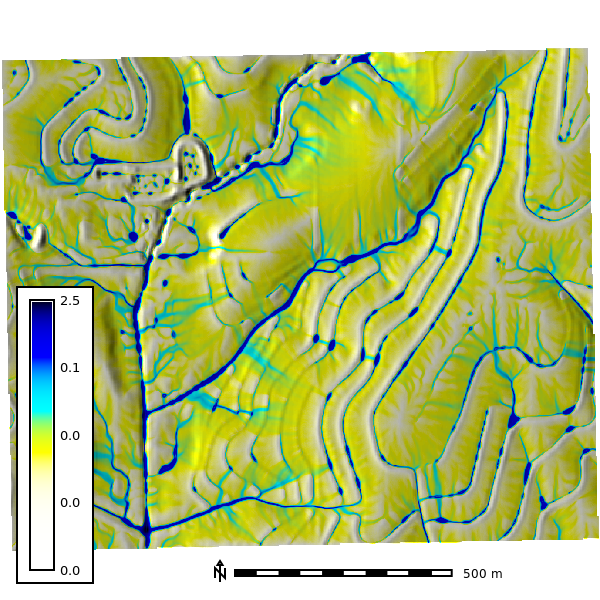
The mean value shows the smoothed result of taking the mean output from 10 model runs. This in practice multiplies the number of particles used by 10 times.
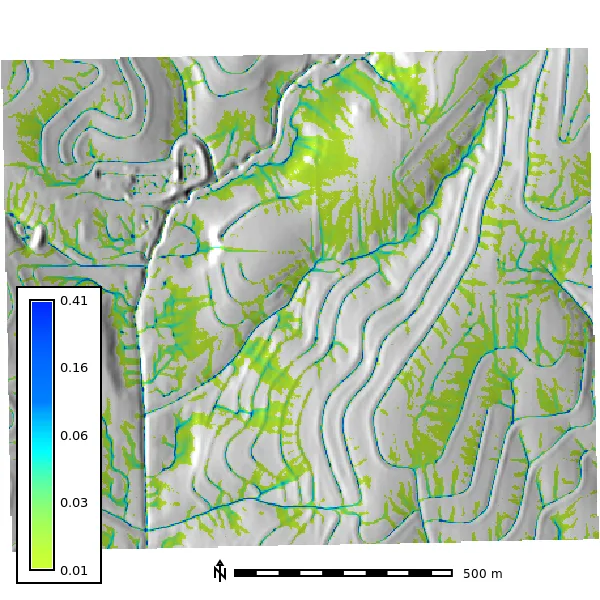
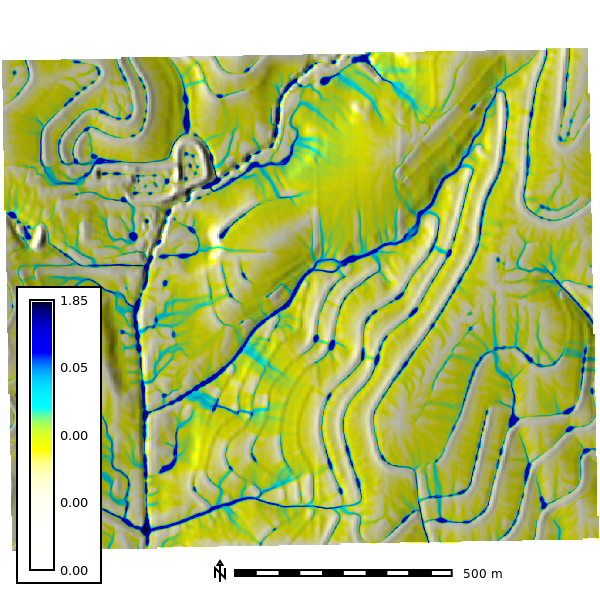
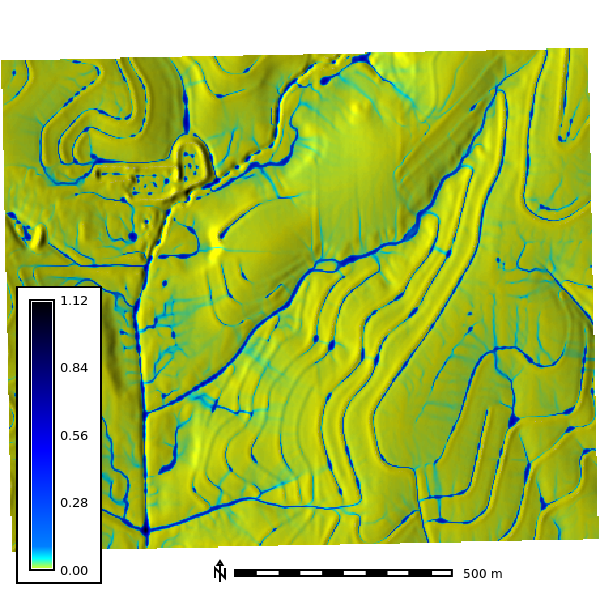
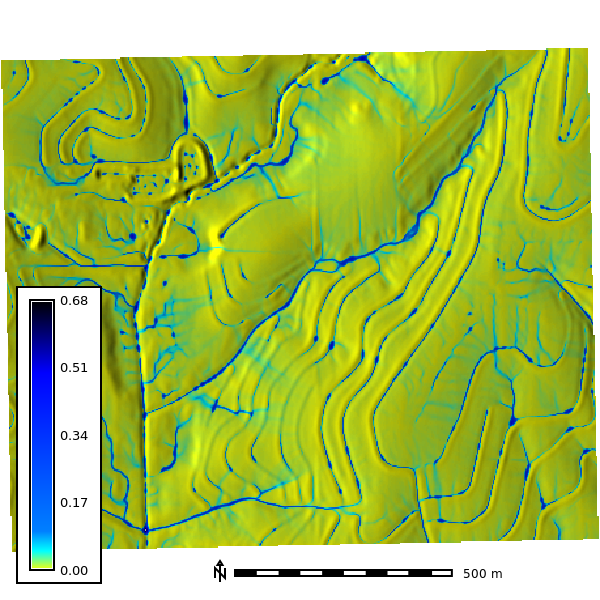
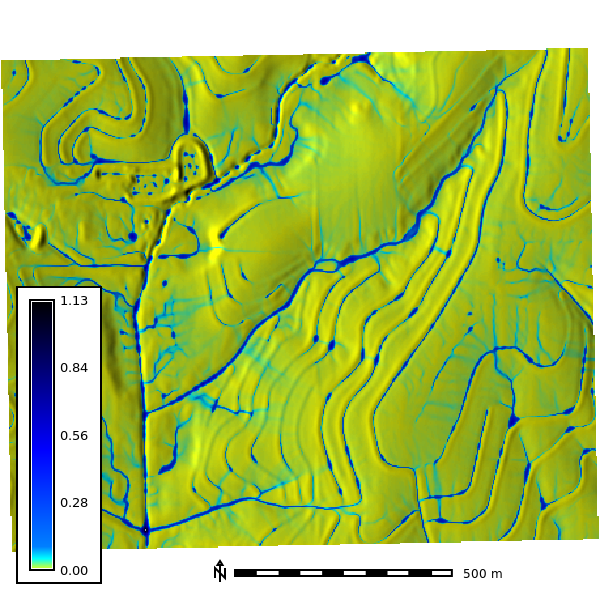
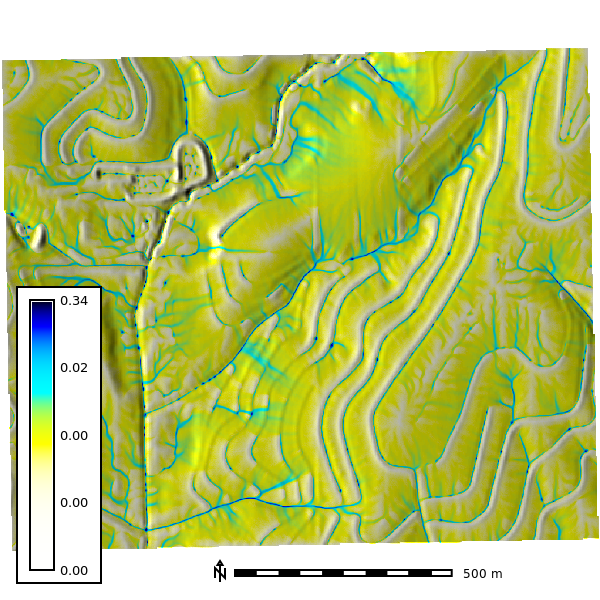
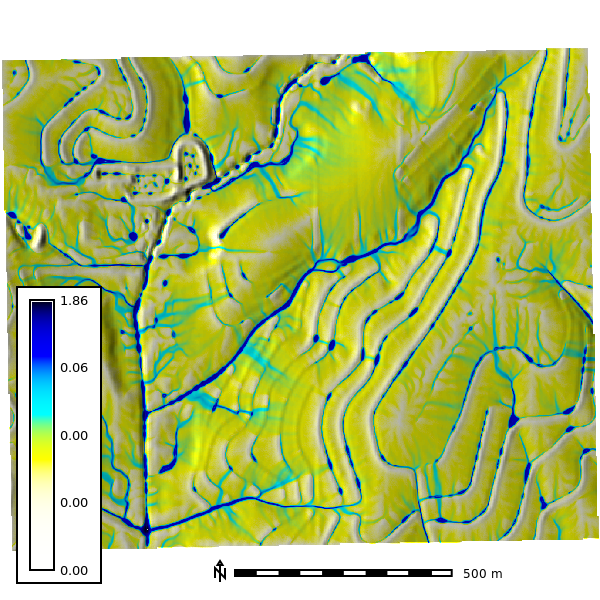
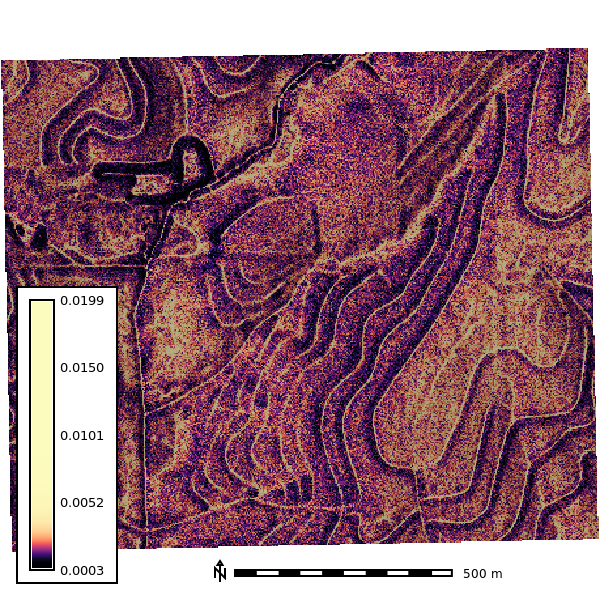
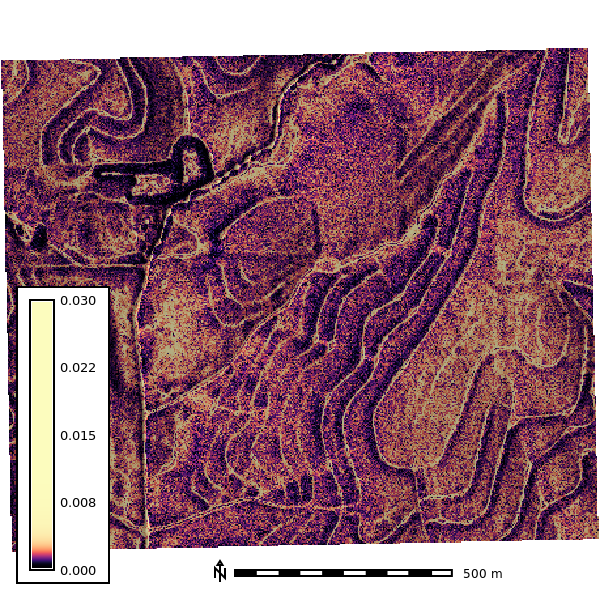
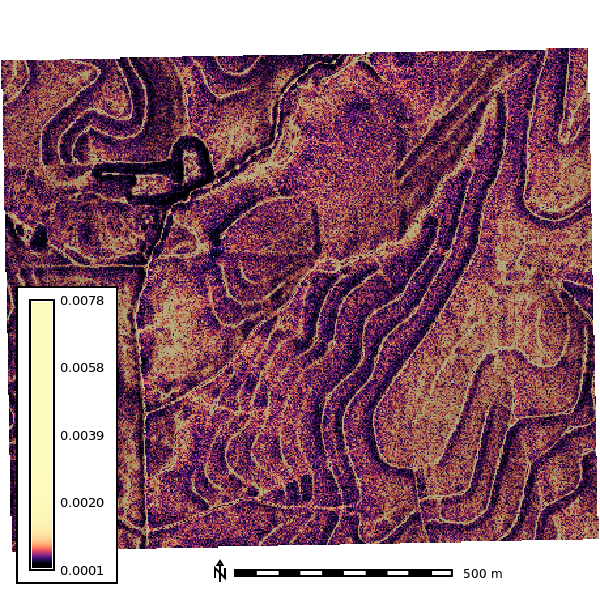
Mean Depth
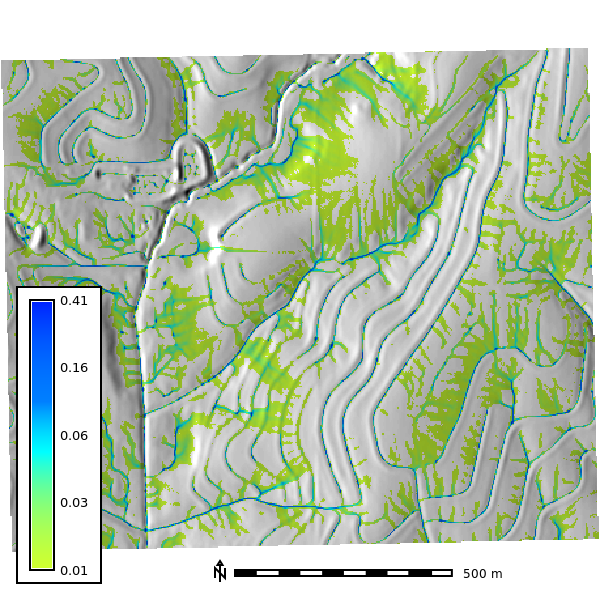 Output Step 5 min
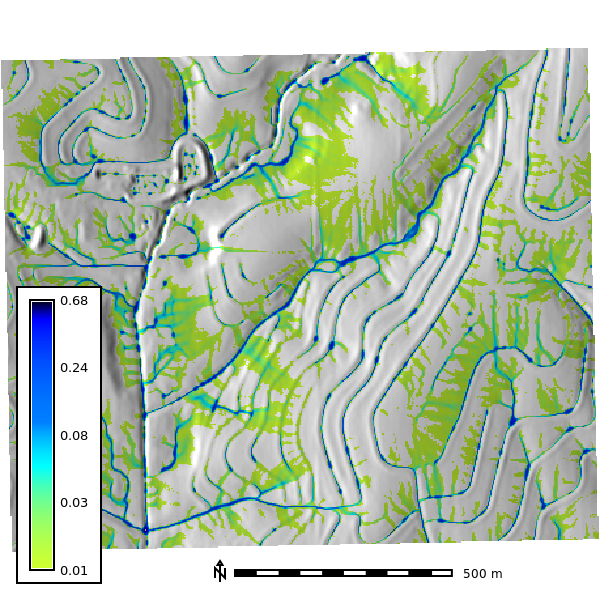
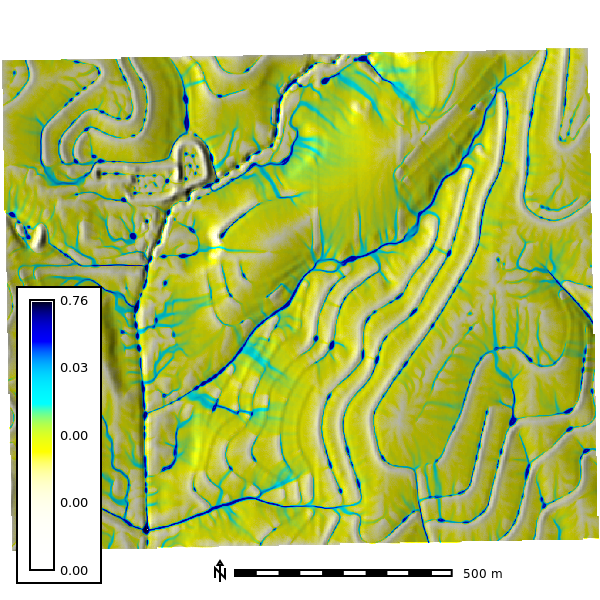
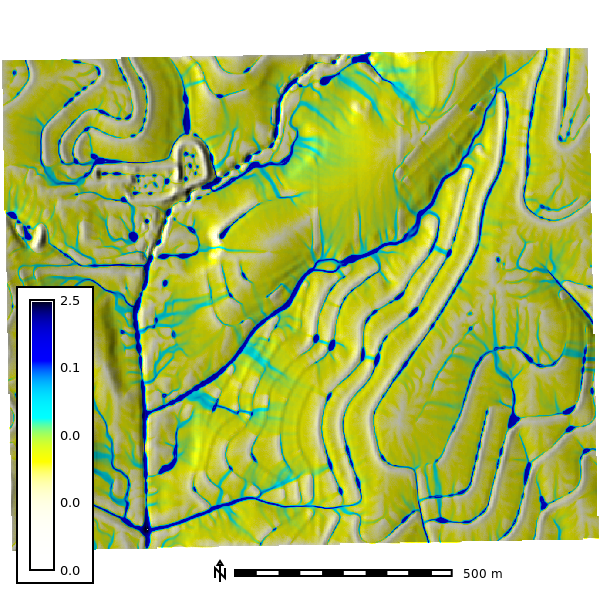
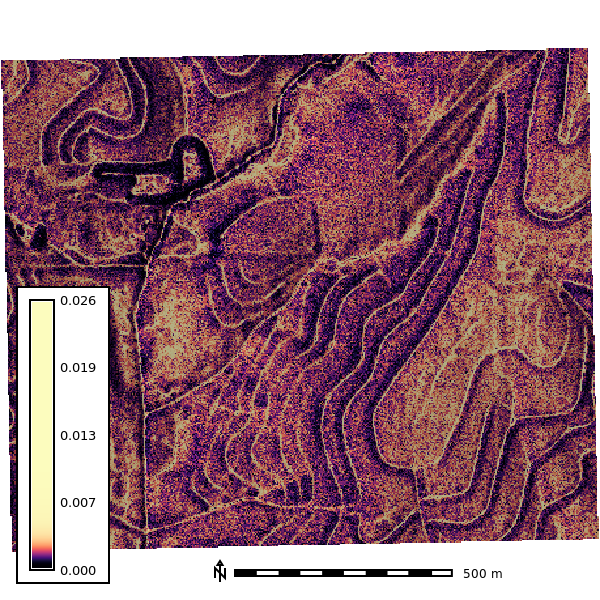
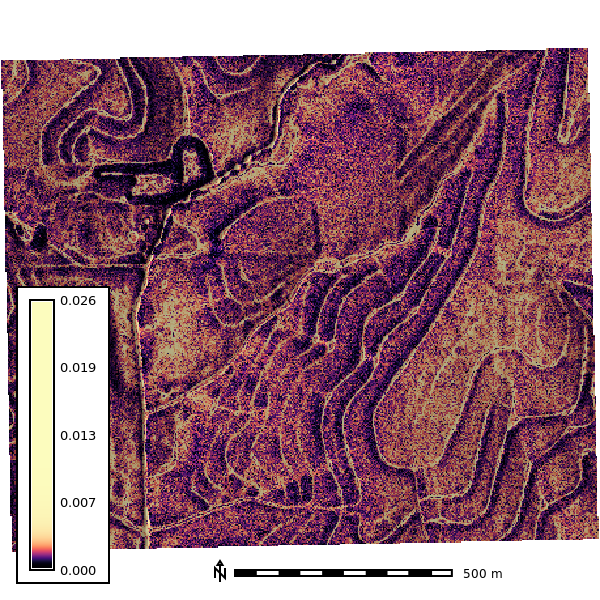
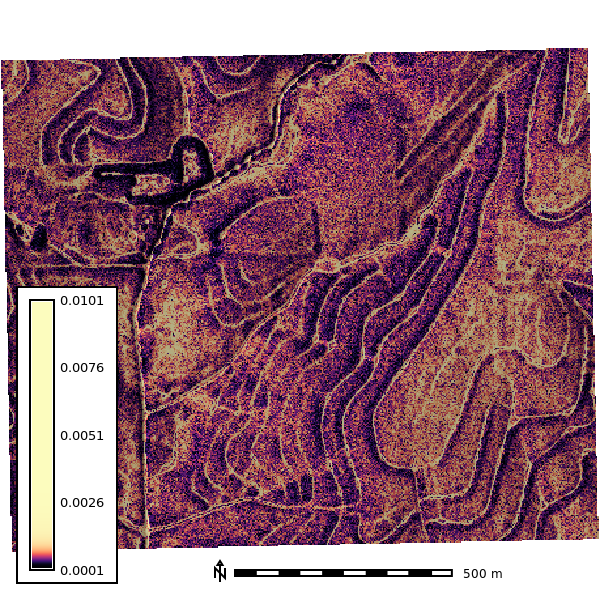
 Output Step 10 min
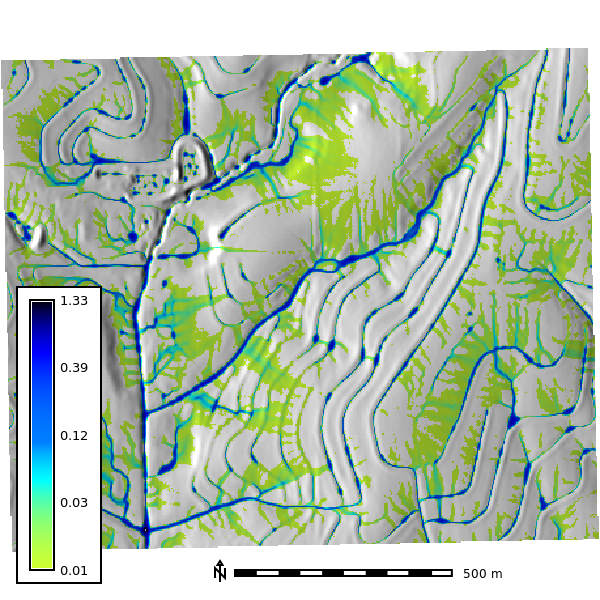
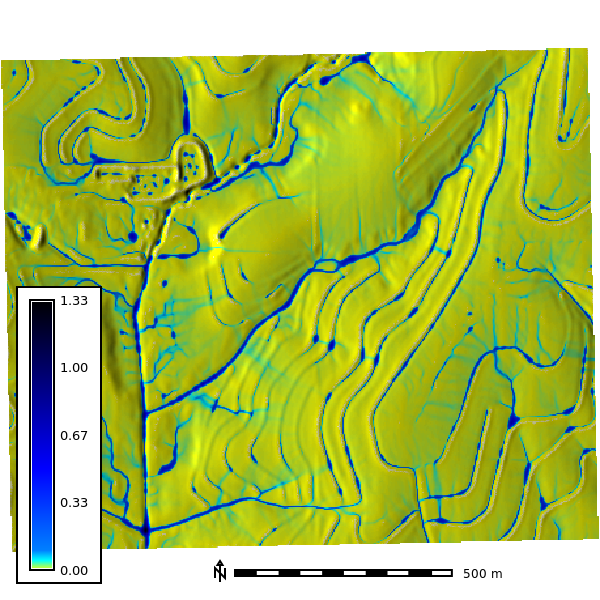
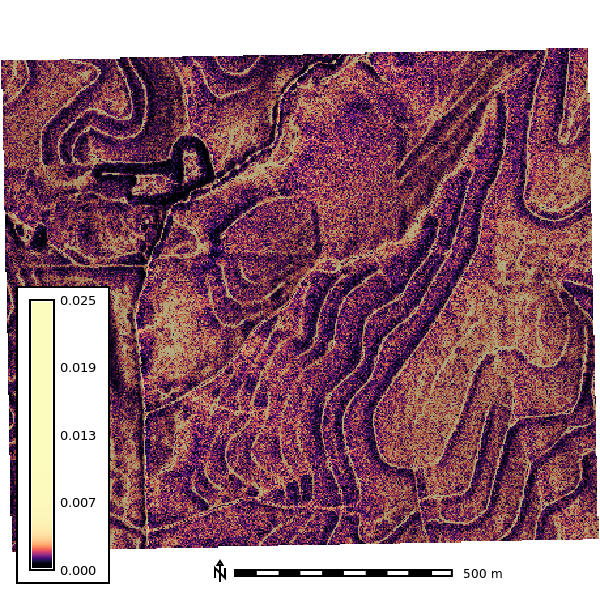
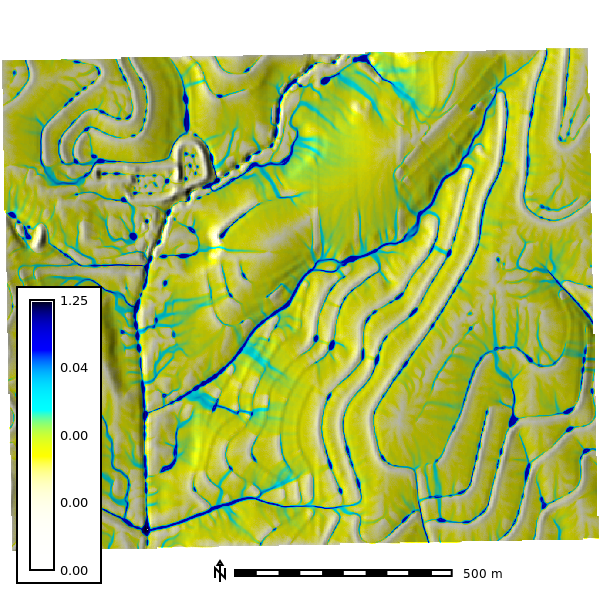
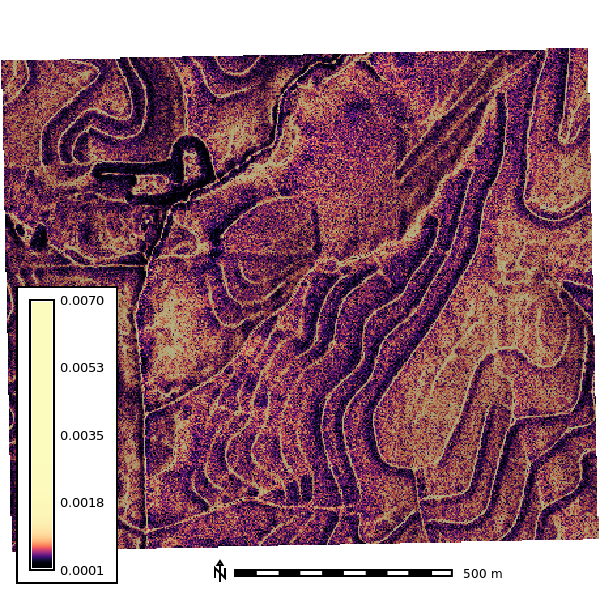
 Output Step 15 min
 Output Step 25 min
 Output Step 30 min
Mean Discharge
 Output Step 5 min
 Output Step 10 min
 Output Step 15 min
 Output Step 25 min
 Output Step 30 min
Median Value
The median smoothed results of taking the median output from 10 model runs. This in practice multiplies the number of particles used by 10 times.
 Output Step 5 min
 Output Step 10 min
 Output Step 15 min
 Output Step 25 min
 Output Step 30 min
Maximum Value
Max Depth
 Output Step 5 min
 Output Step 10 min
 Output Step 15 min
 Output Step 25 min
 Output Step 30 min
Max Discharge
 Output Step 5 min
 Output Step 10 min
 Output Step 15 min
 Output Step 20 min
 Output Step 25 min
 Output Step 30 min
Minimum
 Output Step 5 min
 Output Step 10 min
 Output Step 15 min
 Output Step 25 min
 Output Step 30 min
Range
 Output Step 5 min
 Output Step 10 min
 Output Step 15 min
 Output Step 25 min
 Output Step 30 min
Standard Deviation
 Output Step 5 min
 Output Step 10 min
 Output Step 15 min
 Output Step 25 min
 Output Step 30 min
Max Raster
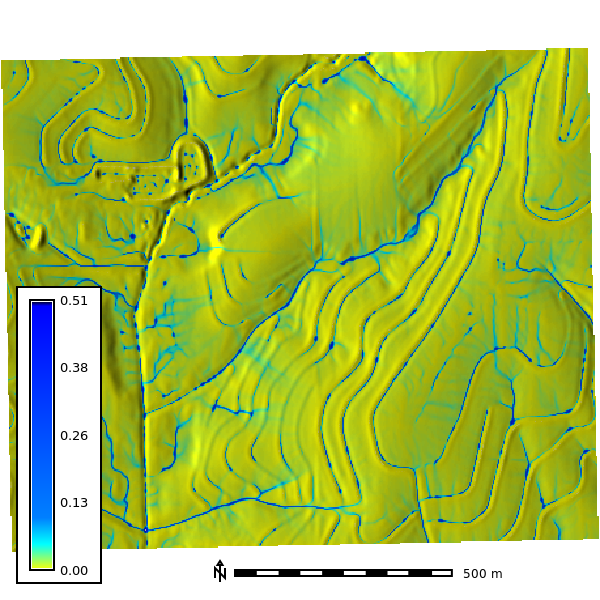
These visualizations represent each walkers vairablilty due to SIMWEs use of the gaussian path sampling method for particles. Each color represents the output raster that contained the maximum values for the cell.
All simulatation are run at \(1 m\) resolution:
10 Seeds
In this figure the output maximum depth rasters were created using r.series filtering the data based on the scheme 1_1_* where 1 represents 1 meter spatial resolution, the particle density is 1, so the number of paritcles is equal to the number of cells, and * is a wildcard for the seed that was used when executing r.sim.water.
 Maximum Depth Output Variablity via Gaussian Path Sampling
Variablility based on Particle Density
Here the the outputs are all from the same seed with varibale particle density (1_*_1)