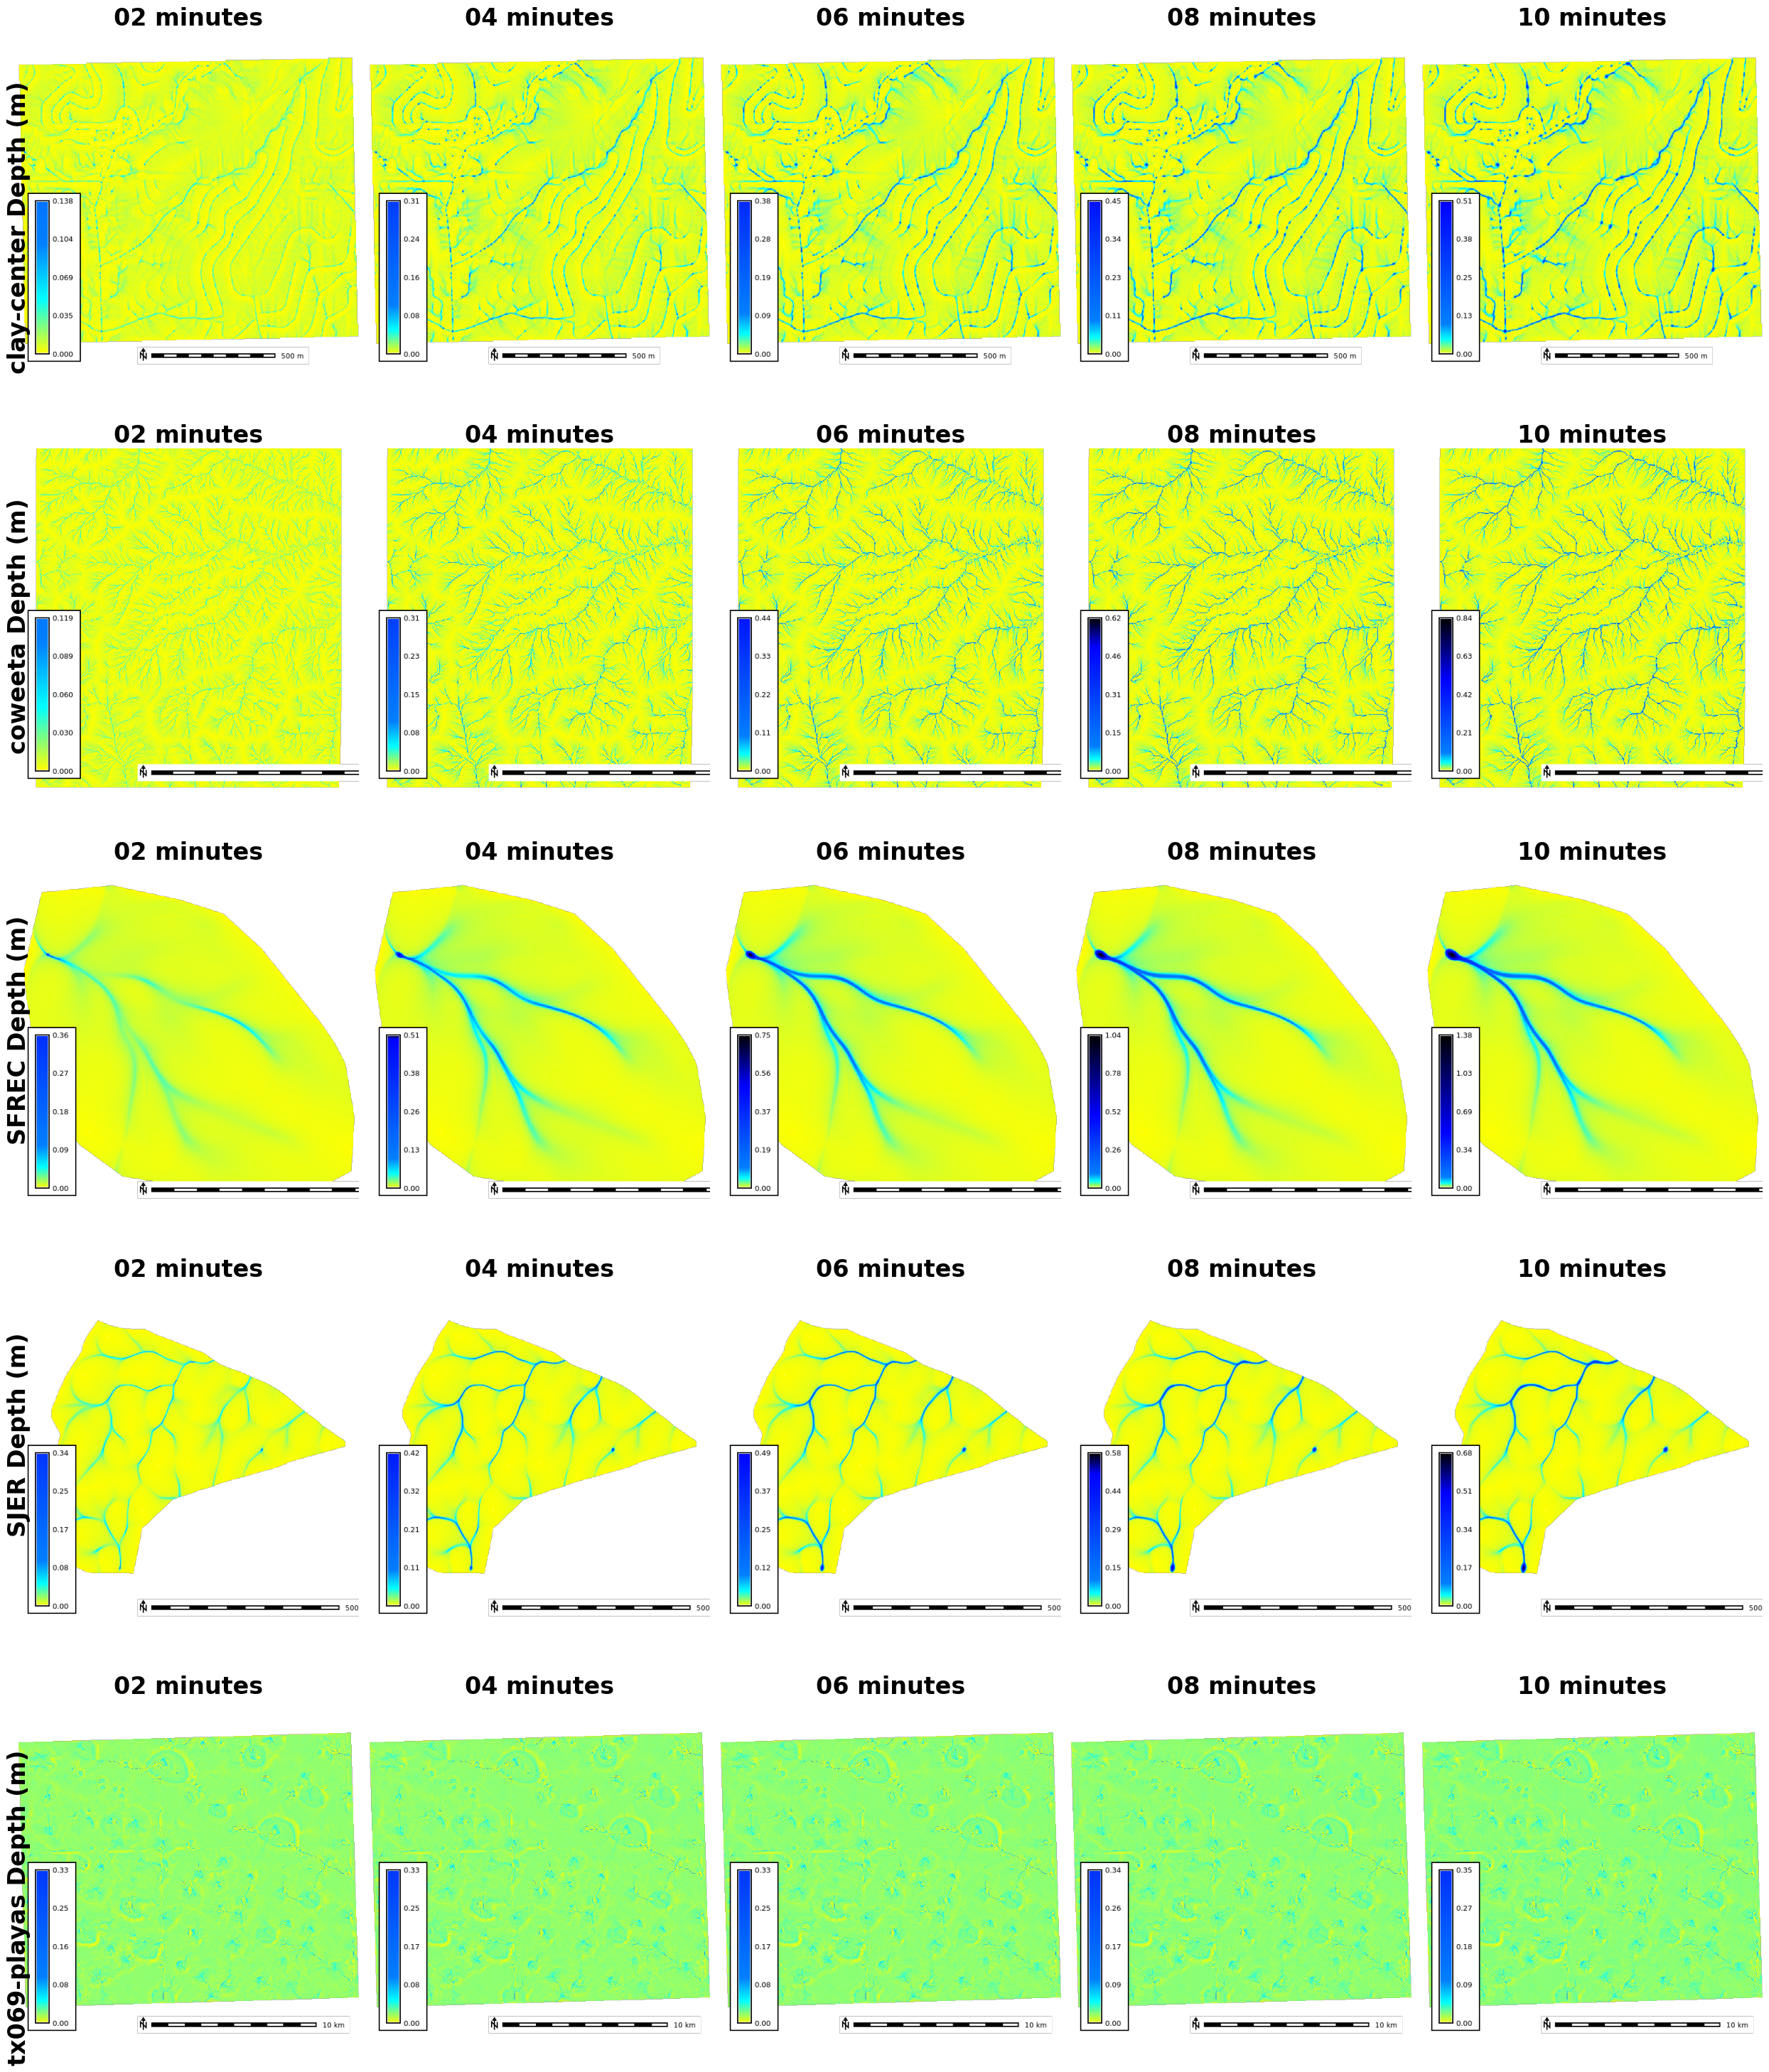
site_params = [
    {'site': 'clay-center', 'crs': '32614', 'res': '3'},
    {'site': 'coweeta', 'crs': '26917', 'res': '10'},
    {'site': 'SFREC', 'crs': '26910', 'res': '1'},
    {'site': 'SJER', 'crs': '26911', 'res': '1'},
    {'site': 'tx069-playas', 'crs': '32613', 'res': '8'}
]

depth_plot_params = []
depth_values = [str(i).zfill(2) for i in range(2, 11, 2)]
for site in site_params:
    for i in depth_values:
        map_name = f"depth.{i}"
        filename = f"output/{site['site']}_depth{i}.png"
        gj.init(gisdb, site['site'], 'basic')
        map_obj = gj.Map(filename=filename, use_region=True, height=600, width=600)
        map_obj.d_rast(map=map_name)
        # map_obj.d_shade(color=map_name, shade="aspect")
        map_obj.d_legend(raster=map_name, at=(5,50,5,9), flags="bl")
        map_obj.d_barscale(at=(35,7), flags="n")
        map_obj.show()
        depth = {
            'filename': filename,
            'title': f"{site['site']} Depth (m)",
            'rast_map': f"{i} minutes"
        }
        depth_plot_params.append(depth)


generate_plots(5, 5, depth_plot_params, "./output/depth_fig.png")