Sensitivity Analysis of Spatial Scale and Particle Density on Overland Flow Pattern Accuracy and Computational Demand
AGU 2024, Washington D.C
2024-12-12

This talk was funded by the USDA Natural Resources Conservation Service (NRCS).
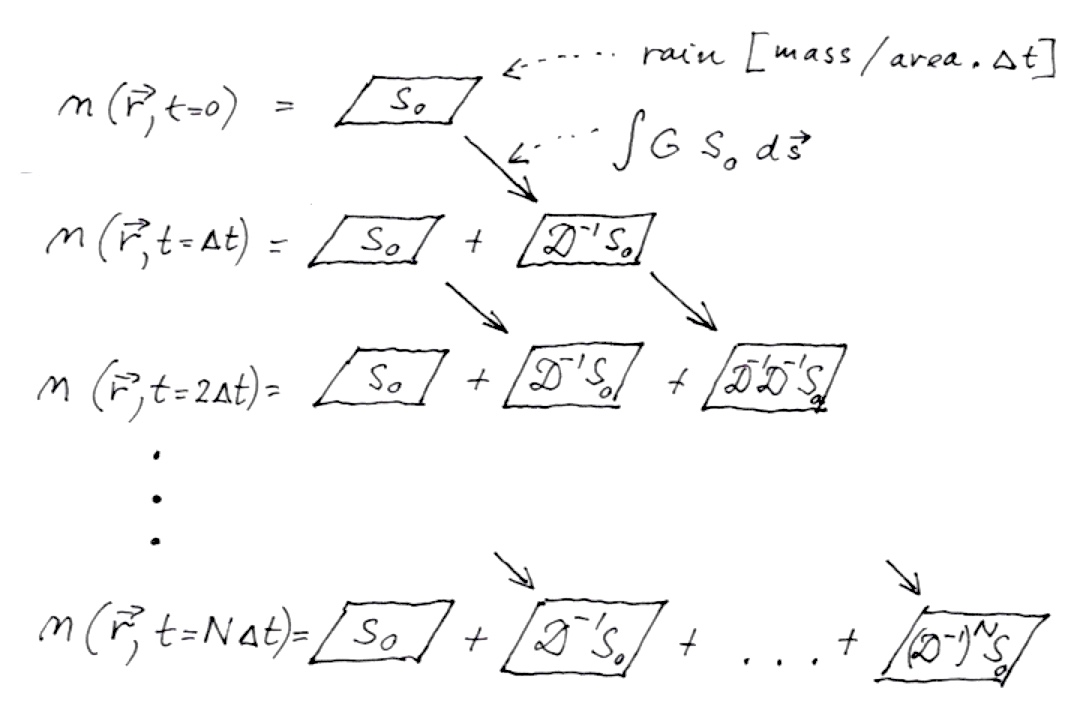
How does SIMWE work?
SIMWE uses Green’s function to solve the St. Venant system of equations via a Monte Carlo path sampling method.
Why is this a problem?
- Restrictive for research and policy development
- Emergency management applications require rapid response times
- Accuracy depends on particle density
- Spatial scale influences particle density required for accurate results
Software

GRASS GIS v8.5
Geospatial Processing Engine
C and Python APIs
Open Source GPL v3
Parallelized (OpenMP)
SIMWE implemented as GRASS module r.sim.water
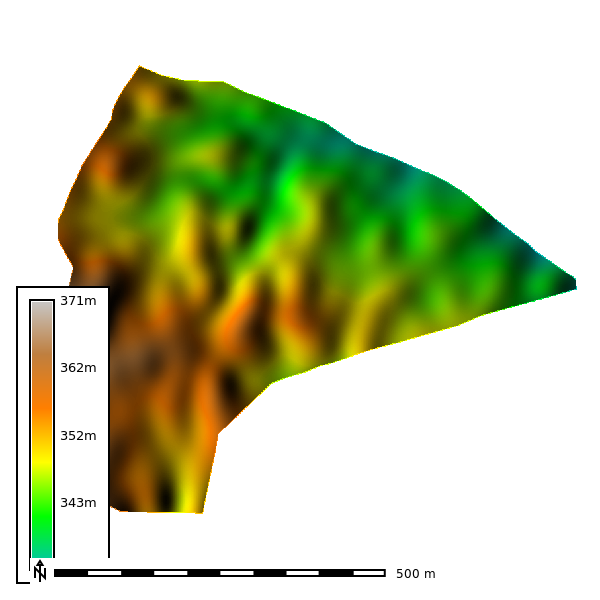
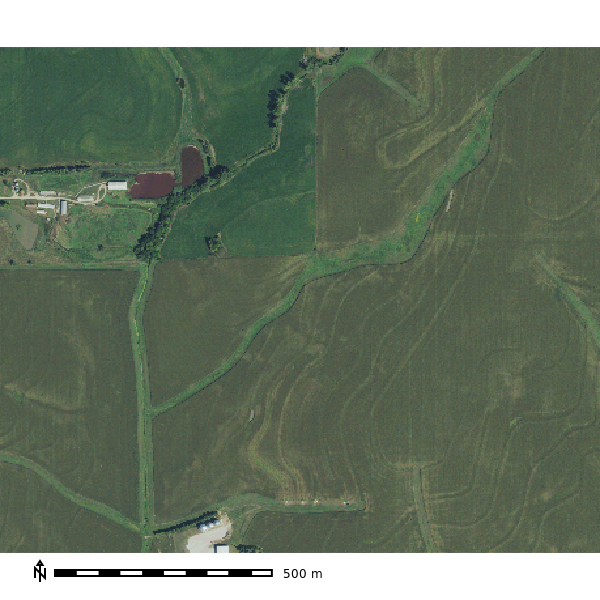
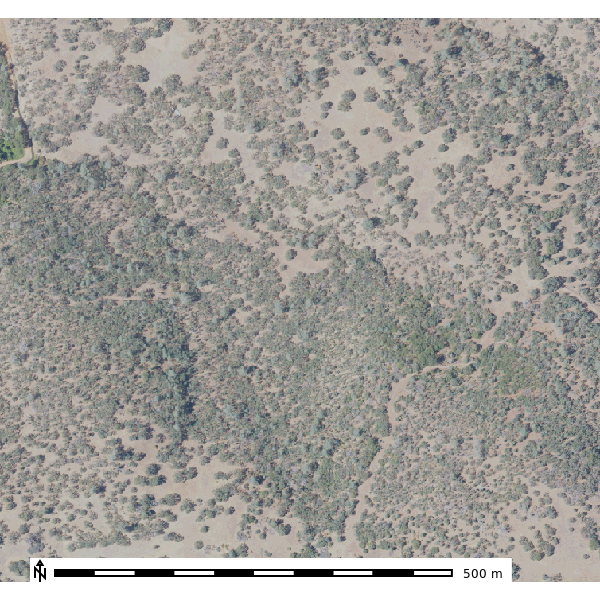
Study Areas - SJER
| Site Details | |
|---|---|
| EPSG | 26911 |
| Res. | 1 \(m\) |
| Cells | 295,126 |
| Area | 0.3 \(km^2\) |
| ARS | 0.14 |
| Elevation | |
|---|---|
| Min - Max | 333.12 - 371.12 \(m\) |
| Range | 38.0 \(m\) |
| Mean | 349.67 \(m\) |
| Std | 7.96 |
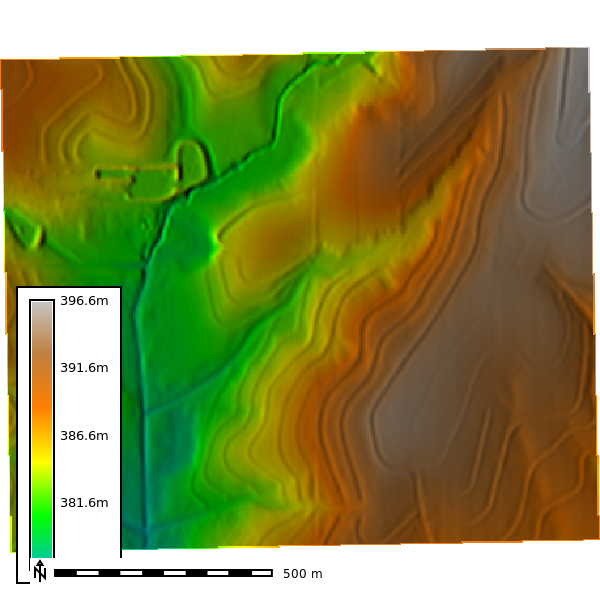
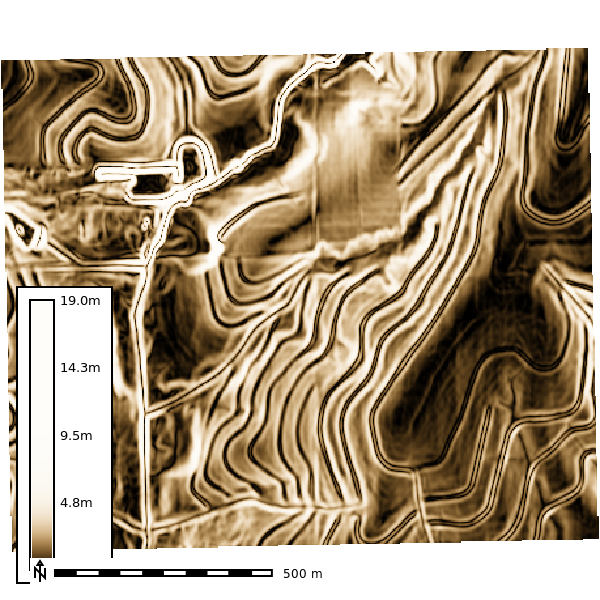
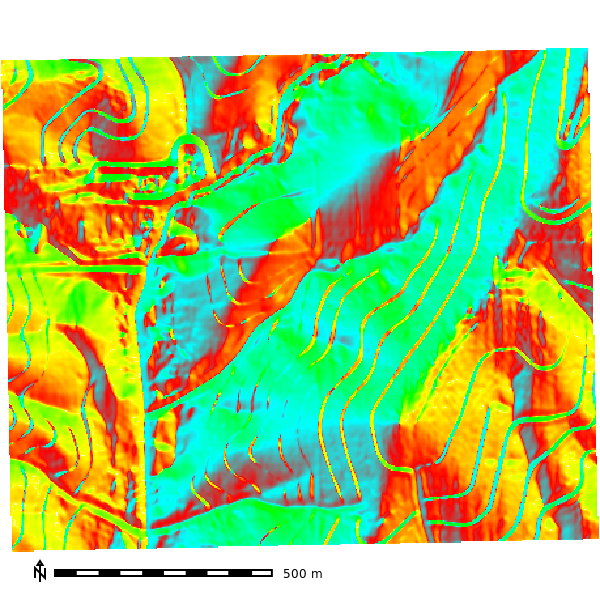
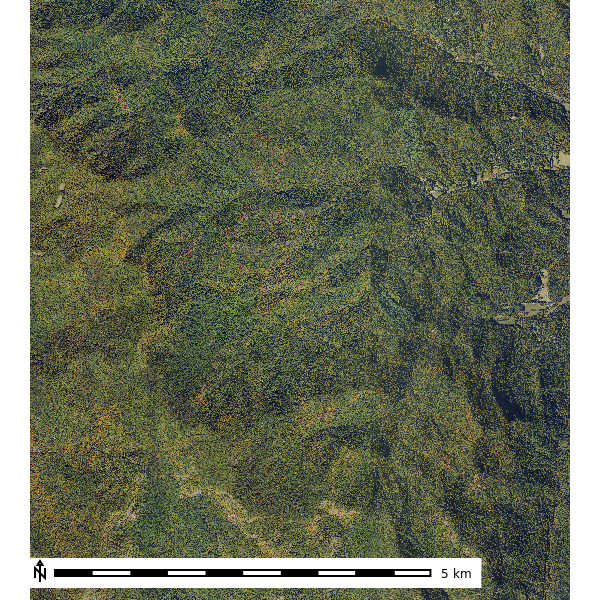
Study Area - Clay Center
| Site Details | |
|---|---|
| EPSG | 32614 |
| Res. | 3 \(m\) |
| Cells | 170,244 |
| Area | 1.53 \(km^2\) |
| ARS | 0.13 |
| Elevation | |
|---|---|
| Min - Max | 376.69 - 396.57 \(m\) |
| Range | 19.9 \(m\) |
| Mean | 386.71 \(m\) |
| Stddev | 5.03 |
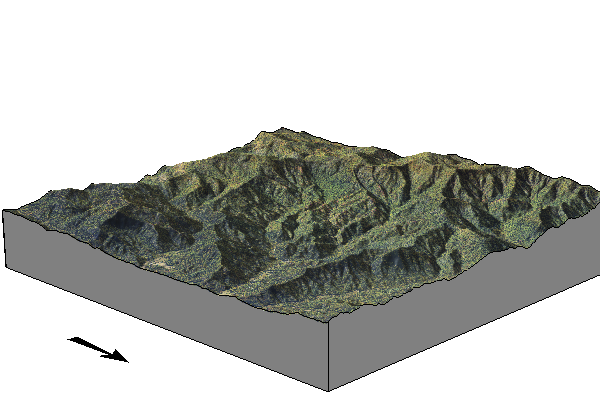
Study Area - Coweeta
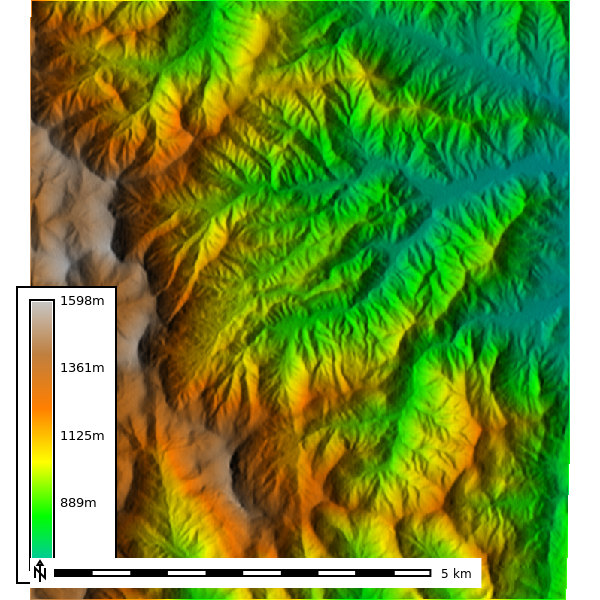
| Site Details | |
|---|---|
| EPSG | 26917 |
| Res. | 10 \(m\) |
| Cells | 572,246 |
| Area | 57.17 \(km^2\) |
| ARS | 5.5 |
| Elevation | |
|---|---|
| Min - Max | 652.8 - 1597.6 \(m\) |
| Range | 944.8 \(m\) |
| Mean | 1043.83 \(m\) |
| Stddev | 230.3 |
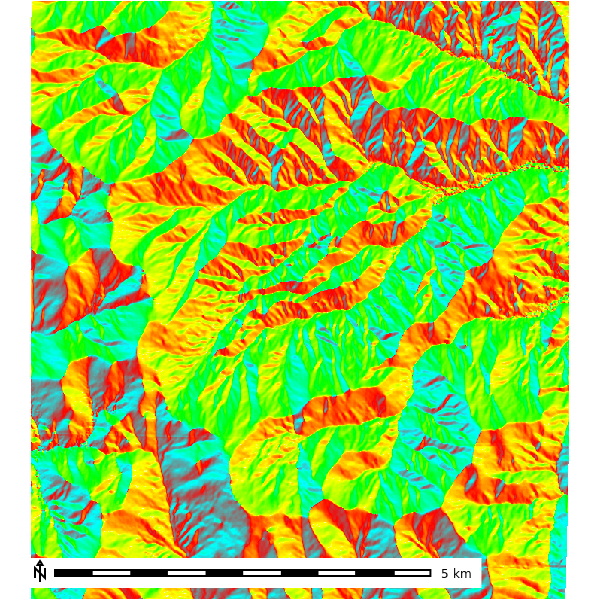
Study Area - SFREC
| Site Details | |
|---|---|
| EPSG | 26910 |
| Res. | 1 \(m\) |
| Cells | 380,014 |
| Area | 0.38 \(km^2\) |
| ARS | 0.37 |
| Elevation | |
|---|---|
| Min - Max | 188.61 - 415.64 \(m\) |
| Range | 227.03 \(m\) |
| Mean | 282.1 \(m\) |
| Stddev | 56.1 |
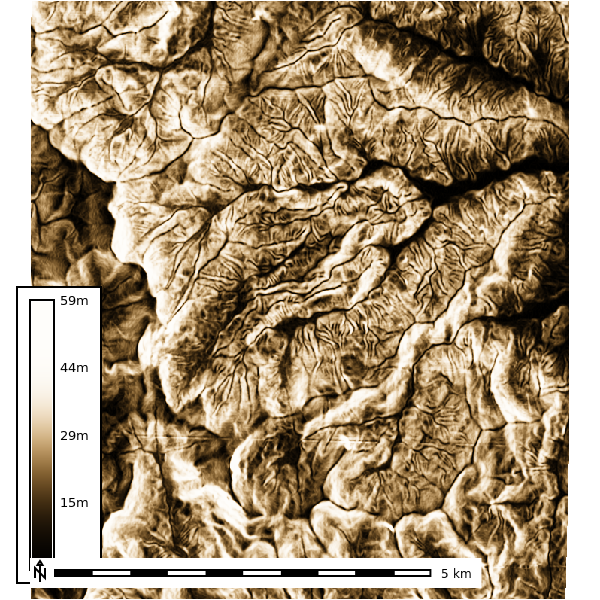
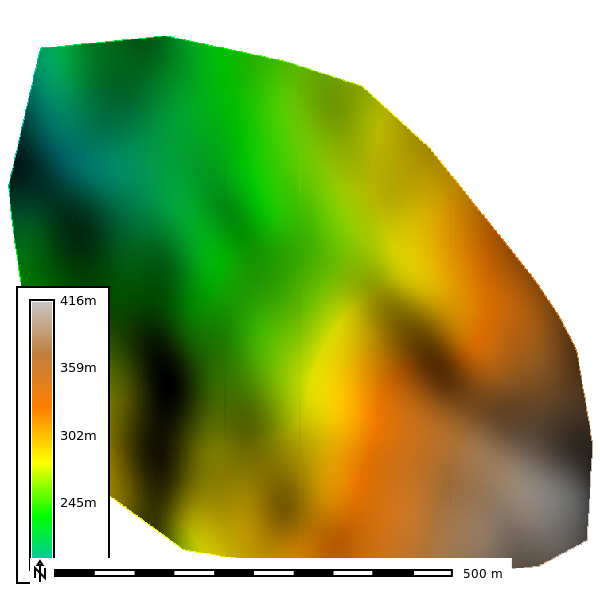
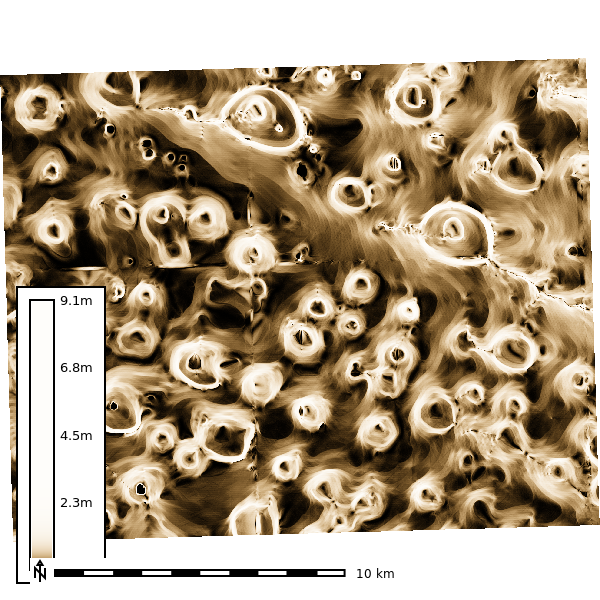
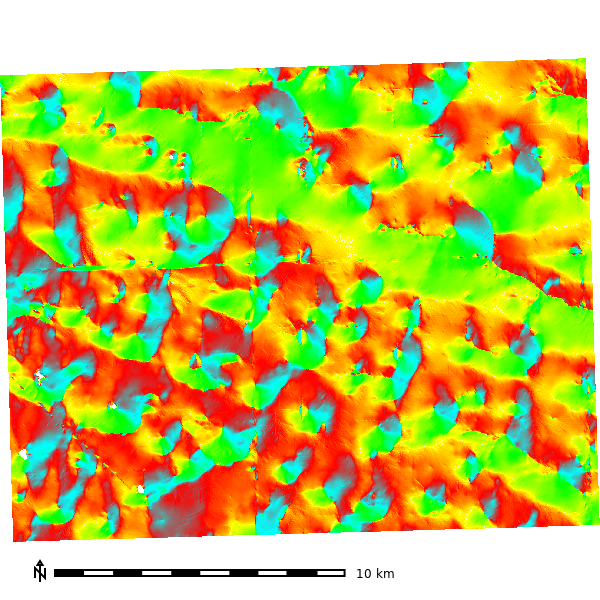
Study Area - tx069-playas
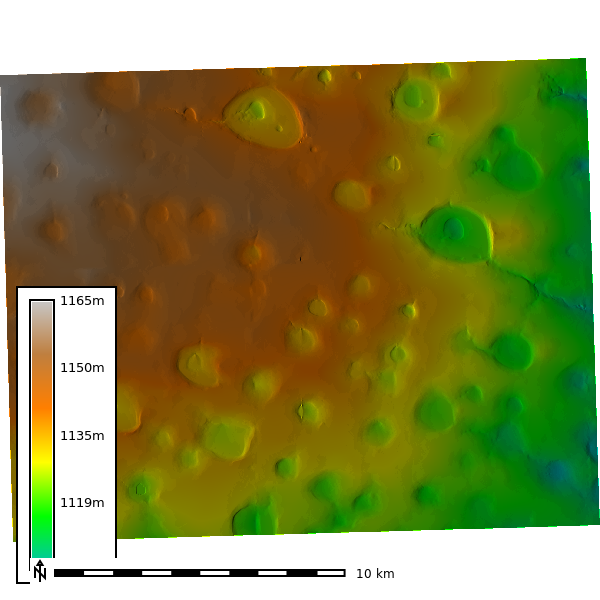
| Site Details | |
|---|---|
| EPSG | 32613 |
| Res. | 8 \(m\) |
| Cells | 5,378,306 |
| Area | 324.74 \(km^2\) |
| ARS | 0.07 |
| Elevation | |
|---|---|
| Min - Max | 1104.0 - 1165.3 \(m\) |
| Range | 61.3 \(m\) |
| Mean | 1134.9 \(m\) |
| Stddev | 13.13 |
Study Areas
| Site | ARS |
|---|---|
| tx069-playas | 0.07 |
| clay-center | 0.13 |
| SJER | 0.14 |
| SFREC | 0.37 |
| Coweeta | 5.5 |
Compute Time

Particles have a greater impact on compute time than resolution.
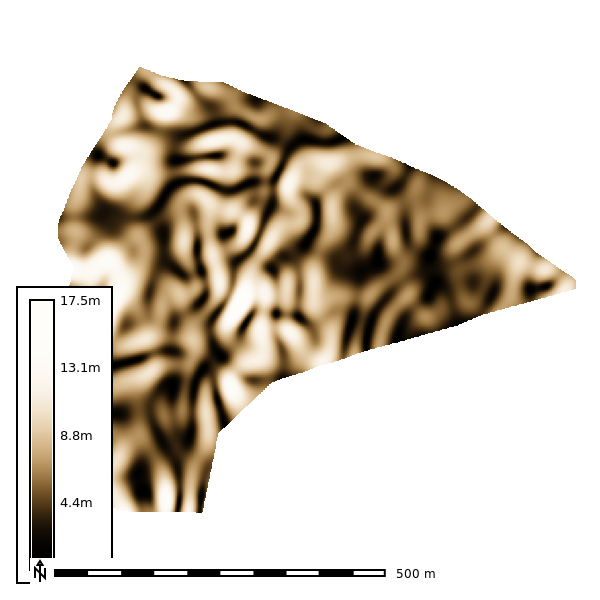
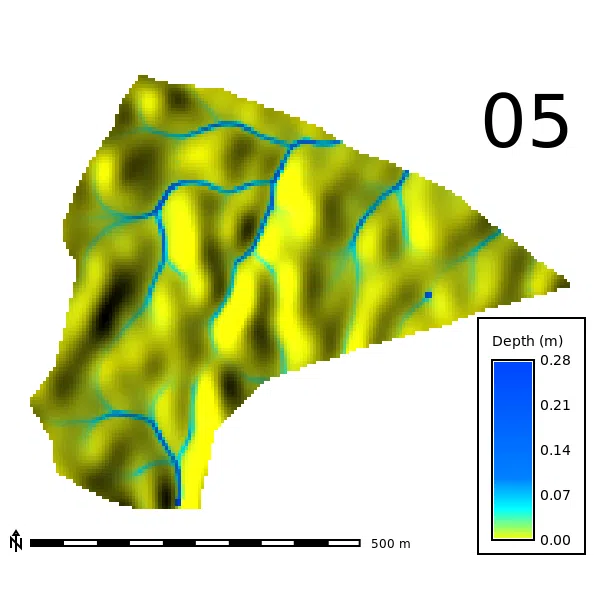
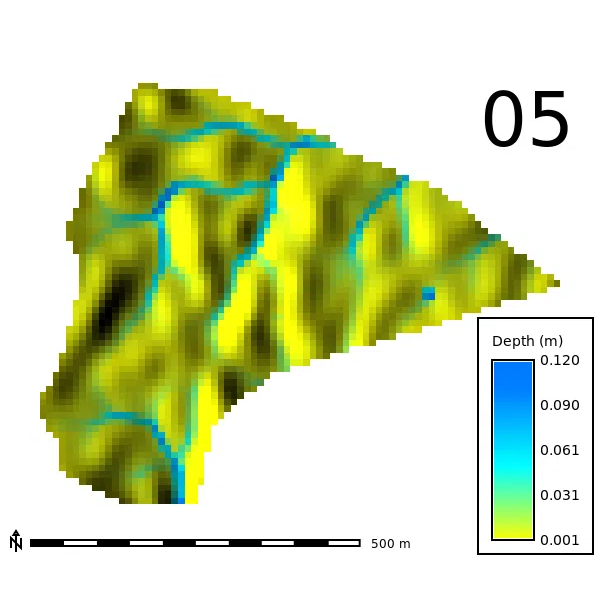
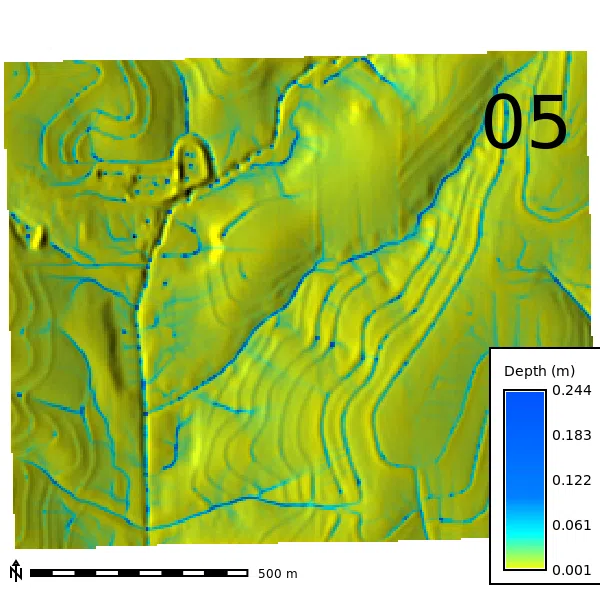
SJER - Mean Depth
1m Resolution, Particle Density: 4x
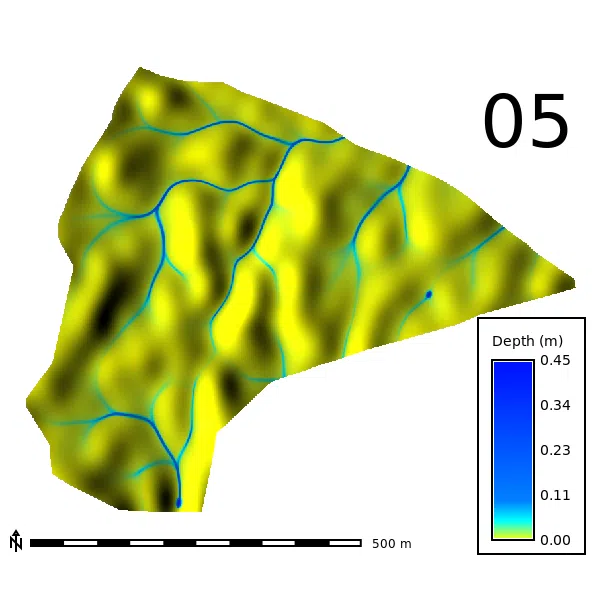
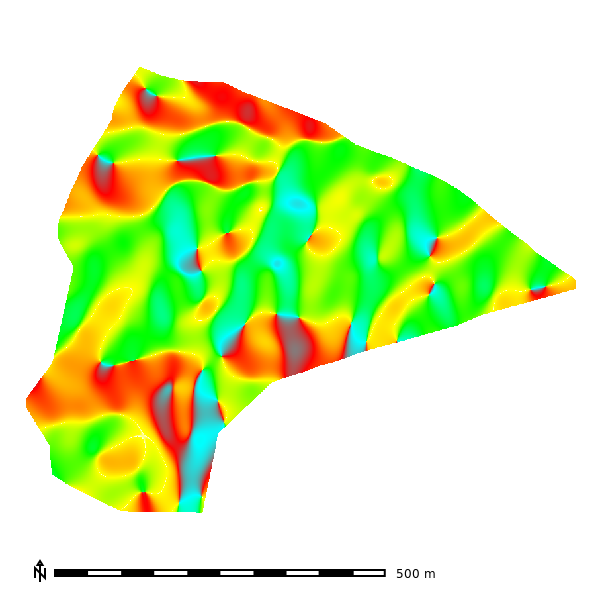
SJER
SJER - Mean Depth, 1m Resolution, Particle Density: 4x
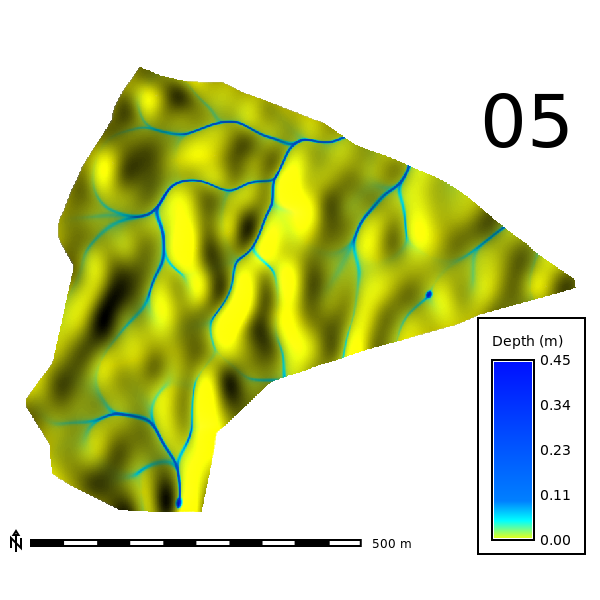
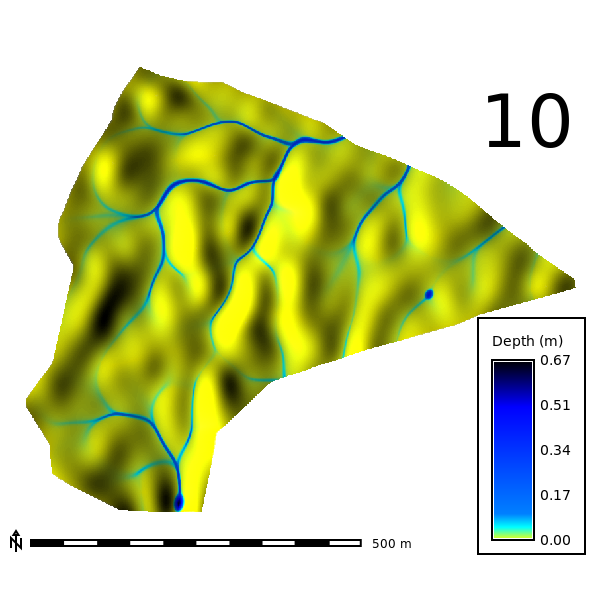


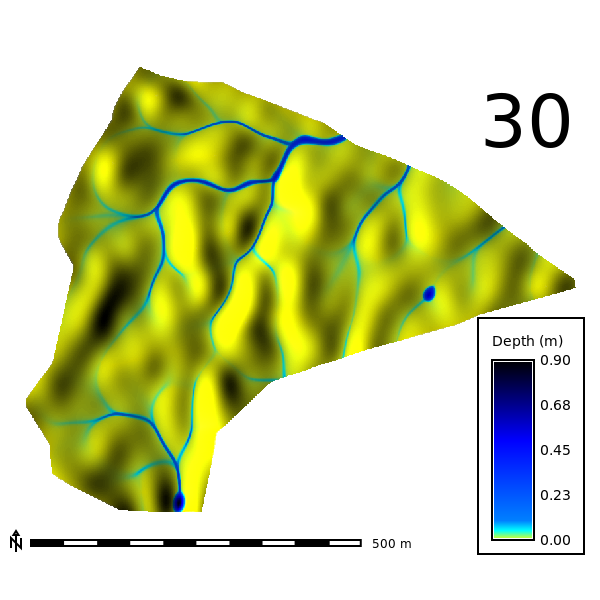
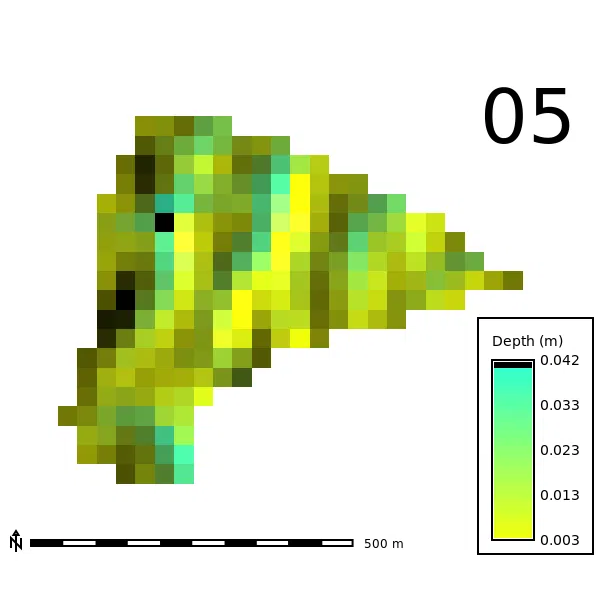
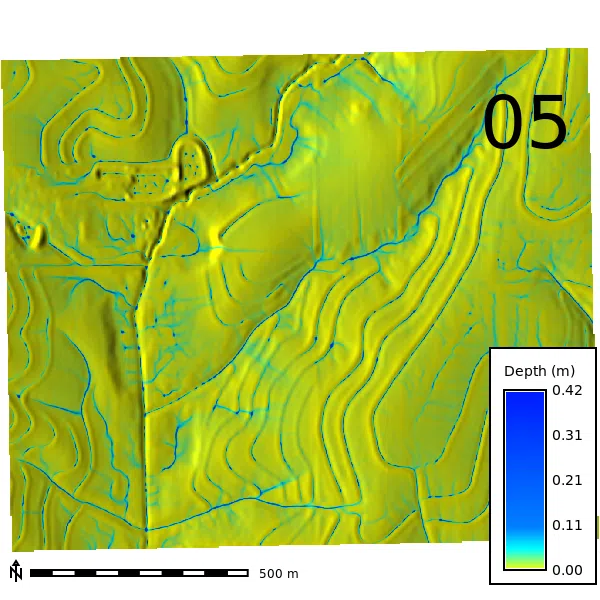
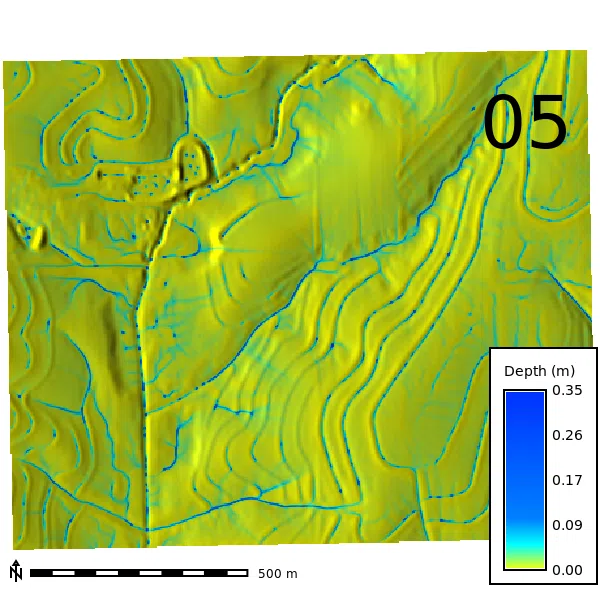
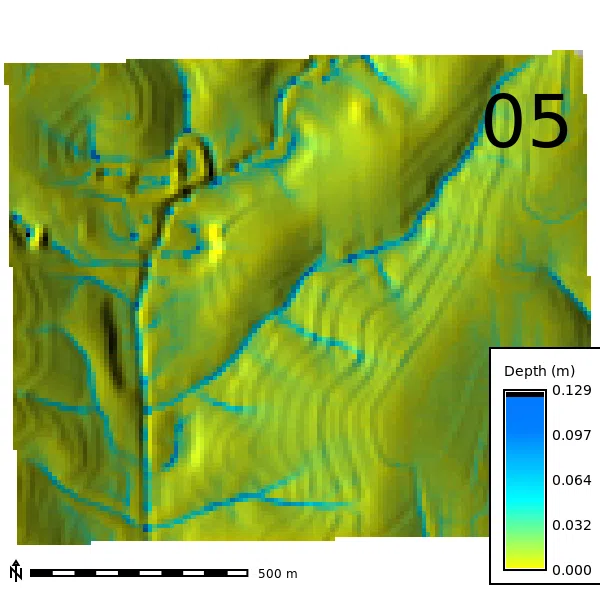
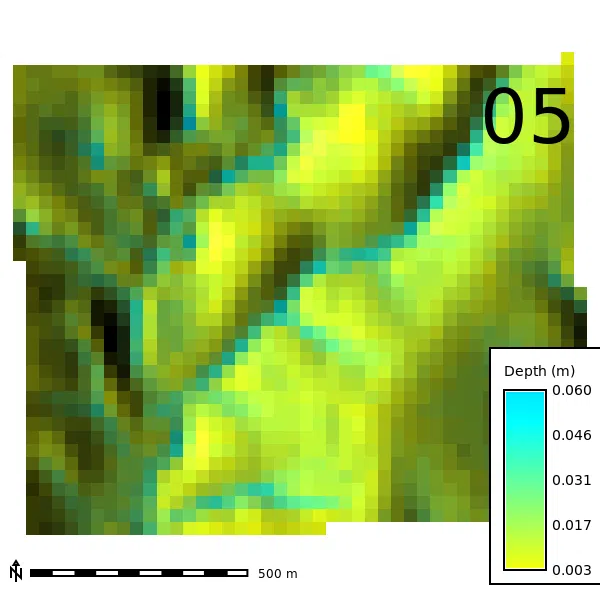
SJER - Mean Flow Depth
0.25x
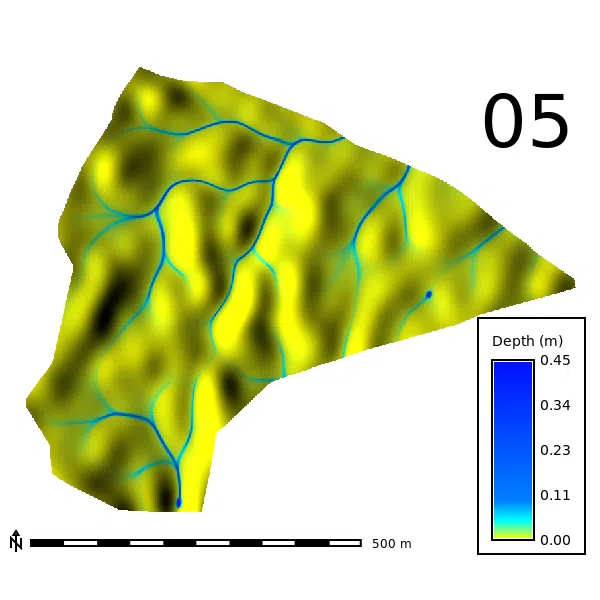

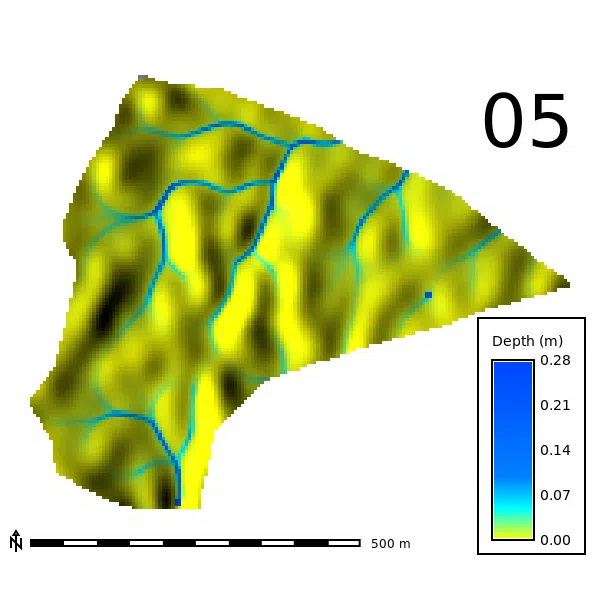

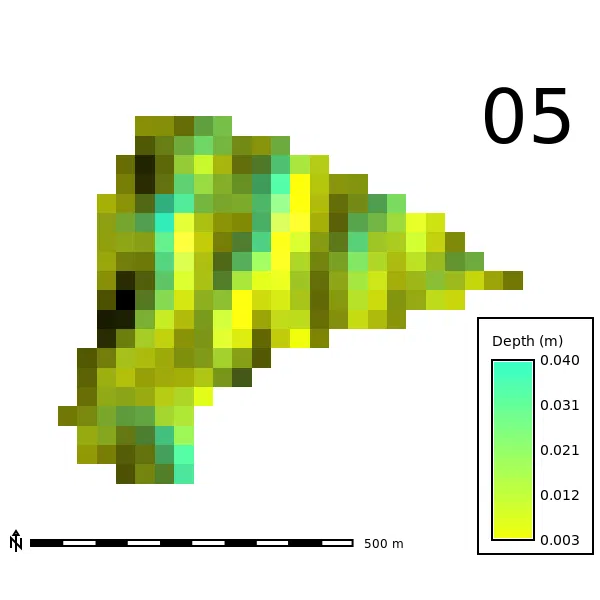
1x

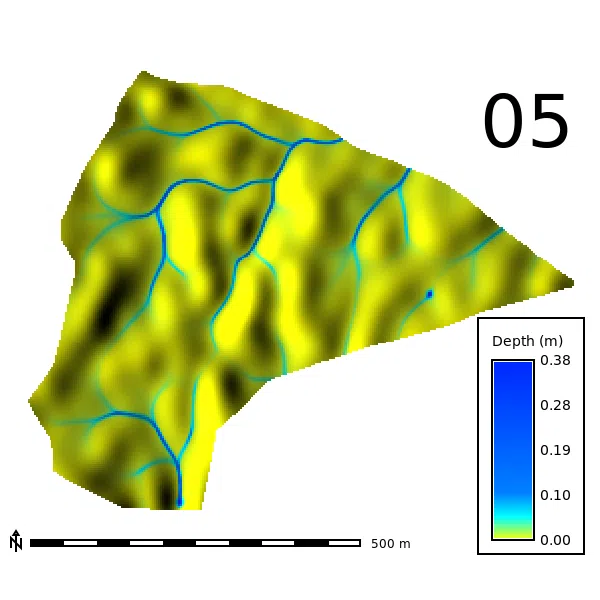


4.0x

Clay Center - Mean Depth
1m Resolution, Particle Density: 4x
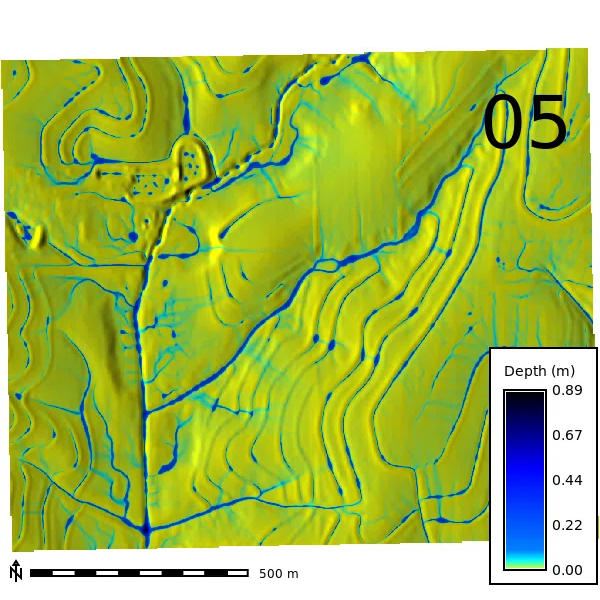
Clay Center - Mean Flow Depth
0.25x

1x


4.0x


Clay Center - \(3m\) 2x

Clay Center - \(10m\) 2x

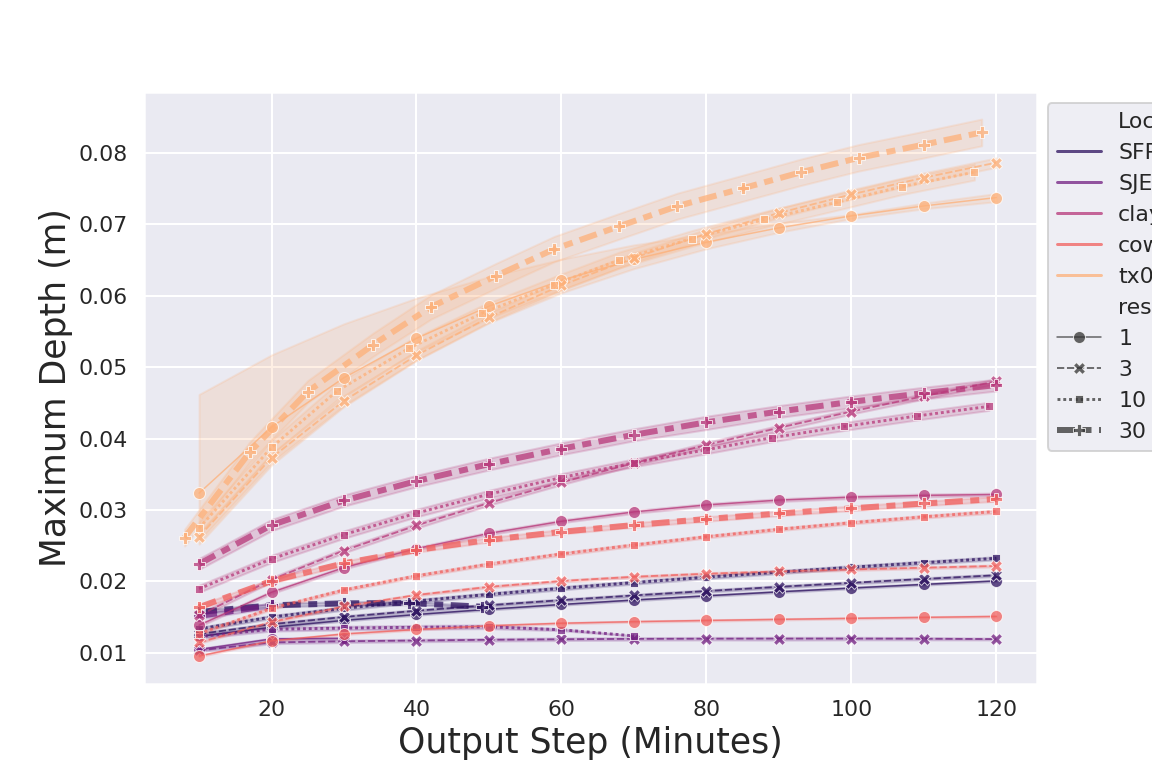
Site Depth Comparison