Exploring changing landscapes
with dynamic visualizations and
tangible interaction
Helena Mitasova


A. Petrasova, V. Petras, B. Harmon, P. Tabrizian, J. Jeziorska
![]()
![]()
From 2D images to 3D digital models
- Lidar technology transformed topography mapping in 21st century
- UAS and SfM made 3D mapping accessible to everybody and any time
- Beyond bare earth: multitemporal mapping vegetation and structures
- 3D data are now ubiquitous so we need easy to use tools to work with them
Tour of elevation data applications
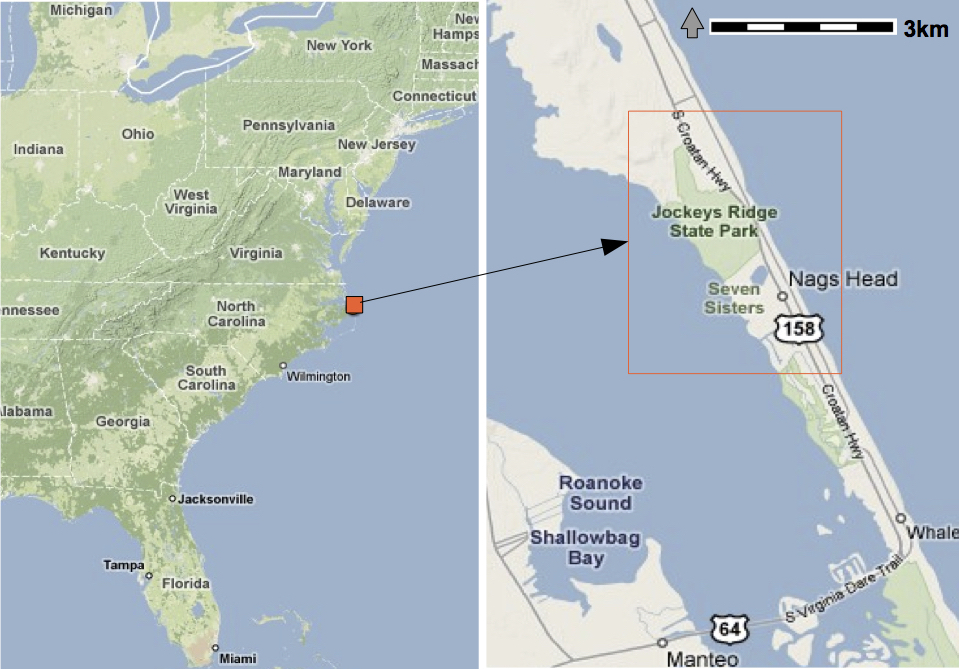
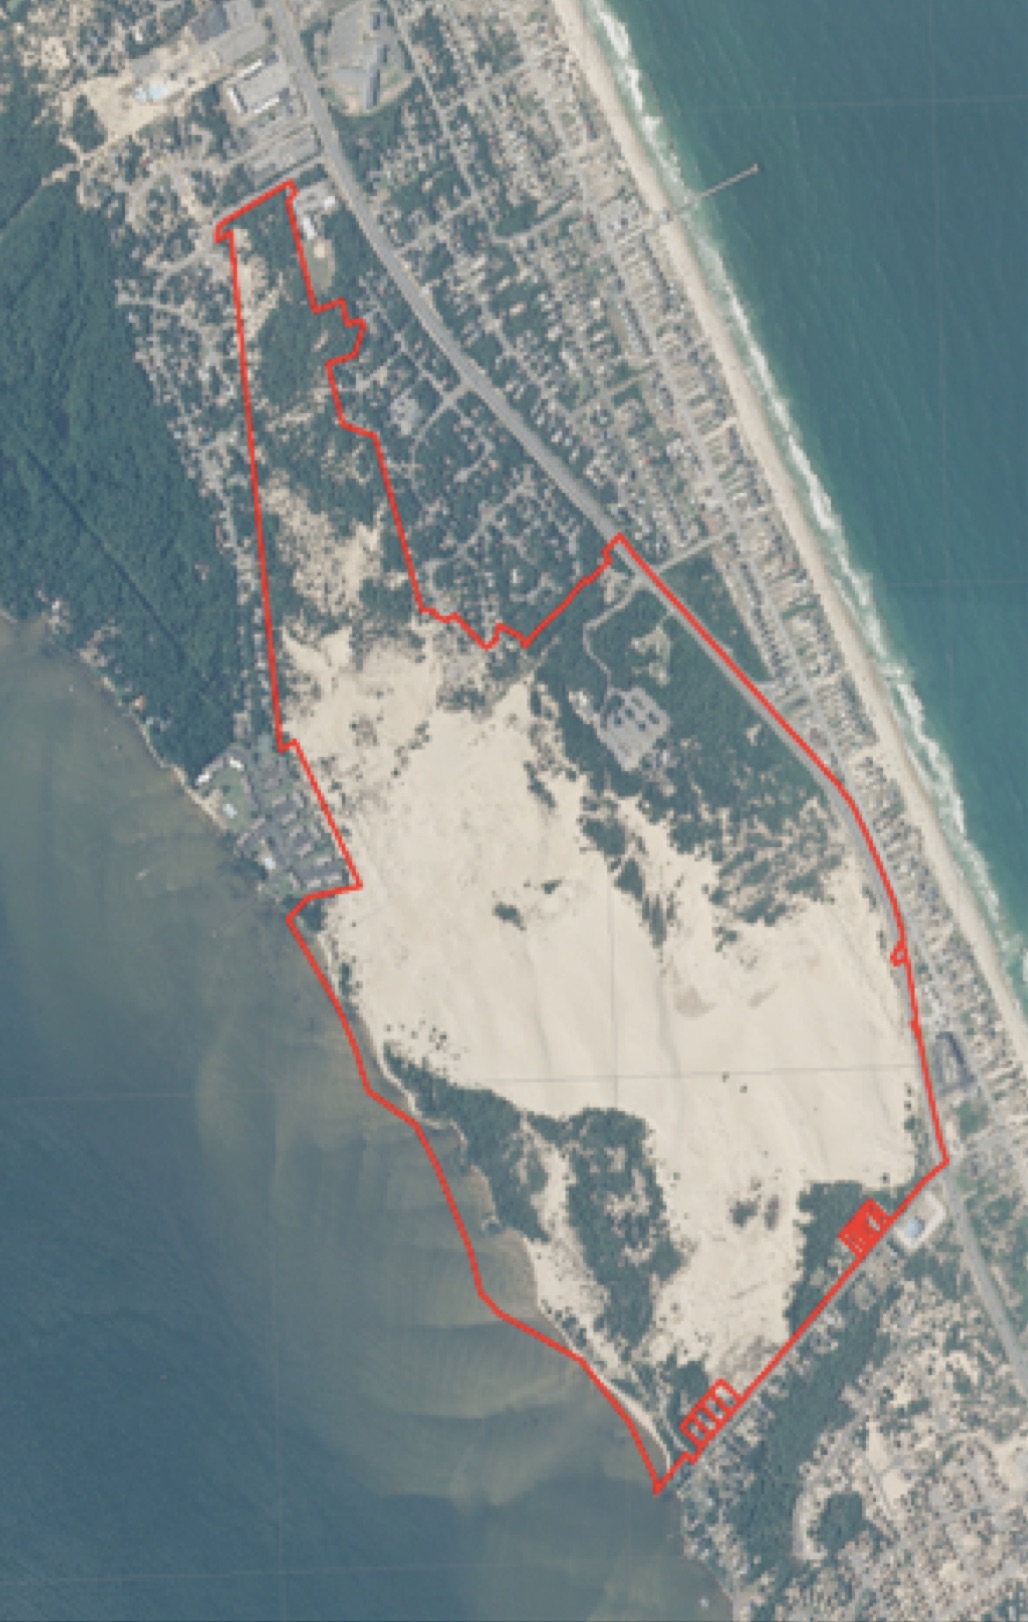
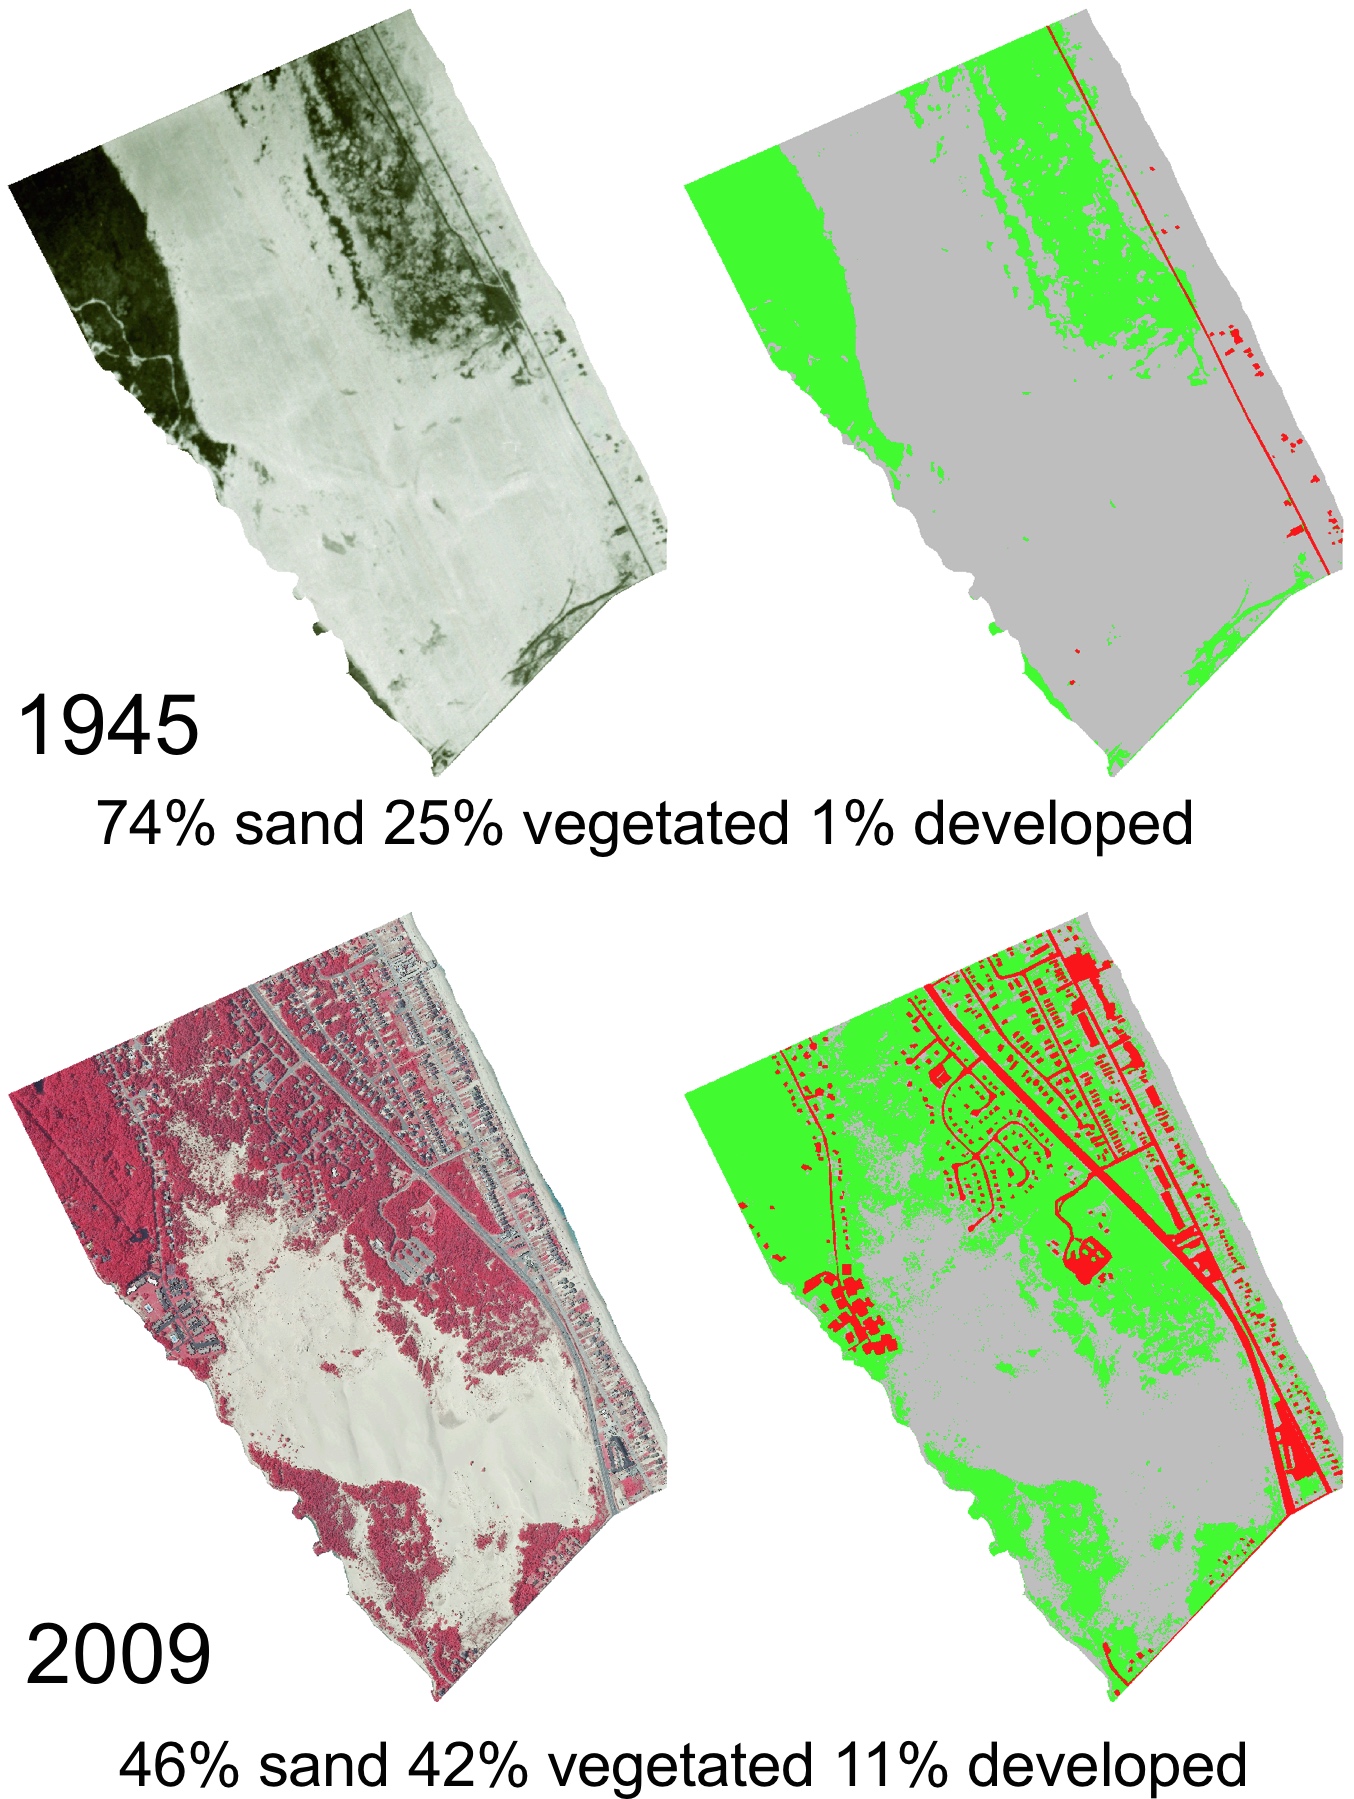
Jockey's Ridge sand dunes
Largest active system on the East coast, located within static state park boundaries
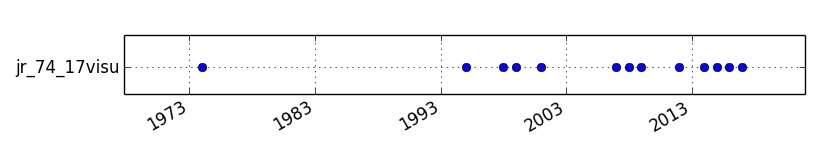
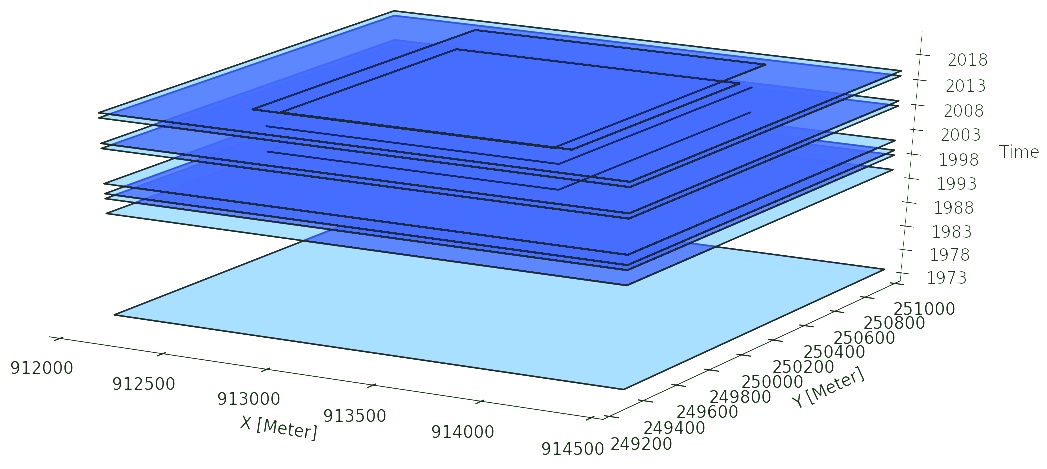
Digital Elevation Model time series
DEMs interpolated at 1m resolution from diverse point data acquired by
- photogrammetry (1974-98),
- lidar (1999-2015),
- structure from motion from UAS imagery (2016-2017)
GRASS GIS temporal framework for managing and analysis of the time series
Gebbert, S., Pebesma, E., 2014. A temporal GIS for field based environmental modeling. Environmental Modelling and Software 53, 1-12.
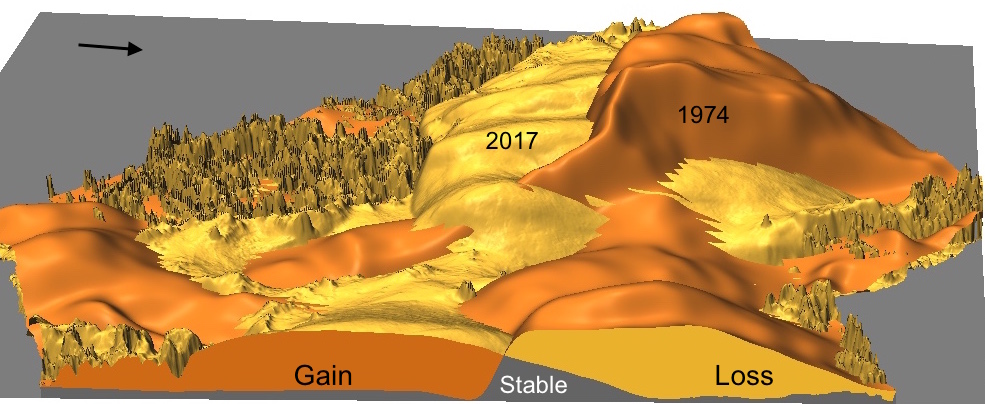
DEM time series visualization
Jockey's Ridge 1974 - 2017: southward migration, landform transformation
from crescentic dune to sand starved, fast moving parabolic dune
DEM time series visualization 1974 - 2017
Annual dynamics from Planet imagery
Satellite imagery at 3m resolution, September 2017 - July 2018, captures impact of storm in March 2018 with large ripples similar to those observed post Mathews
Planet: world’s largest constellation of Earth-imaging (micro) satellites providing daily observations for entire Earth at 3m resolution
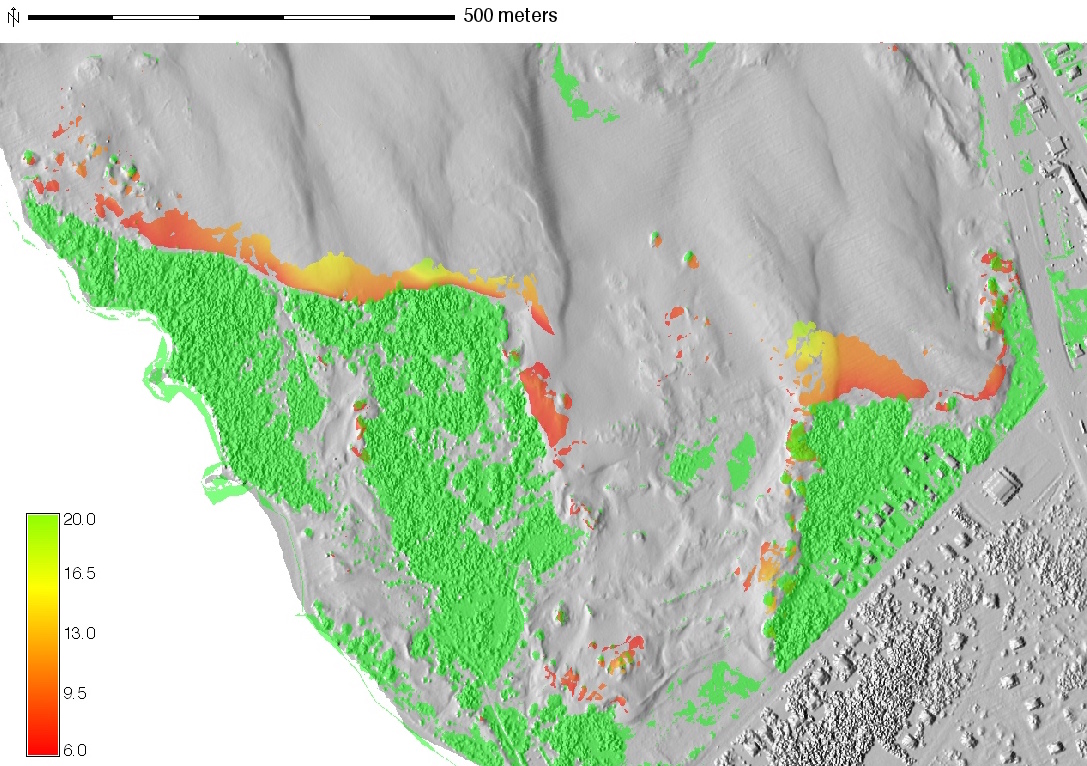
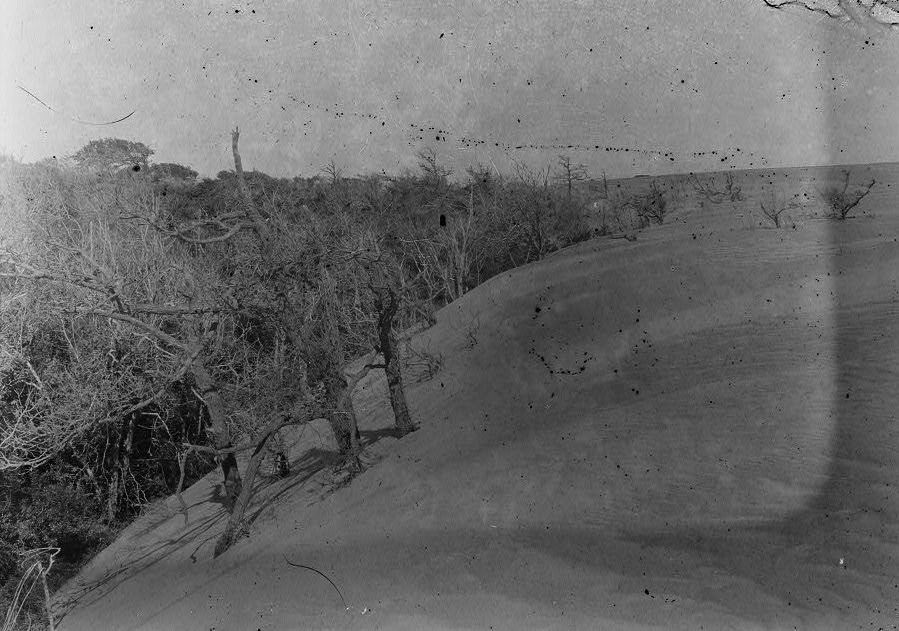
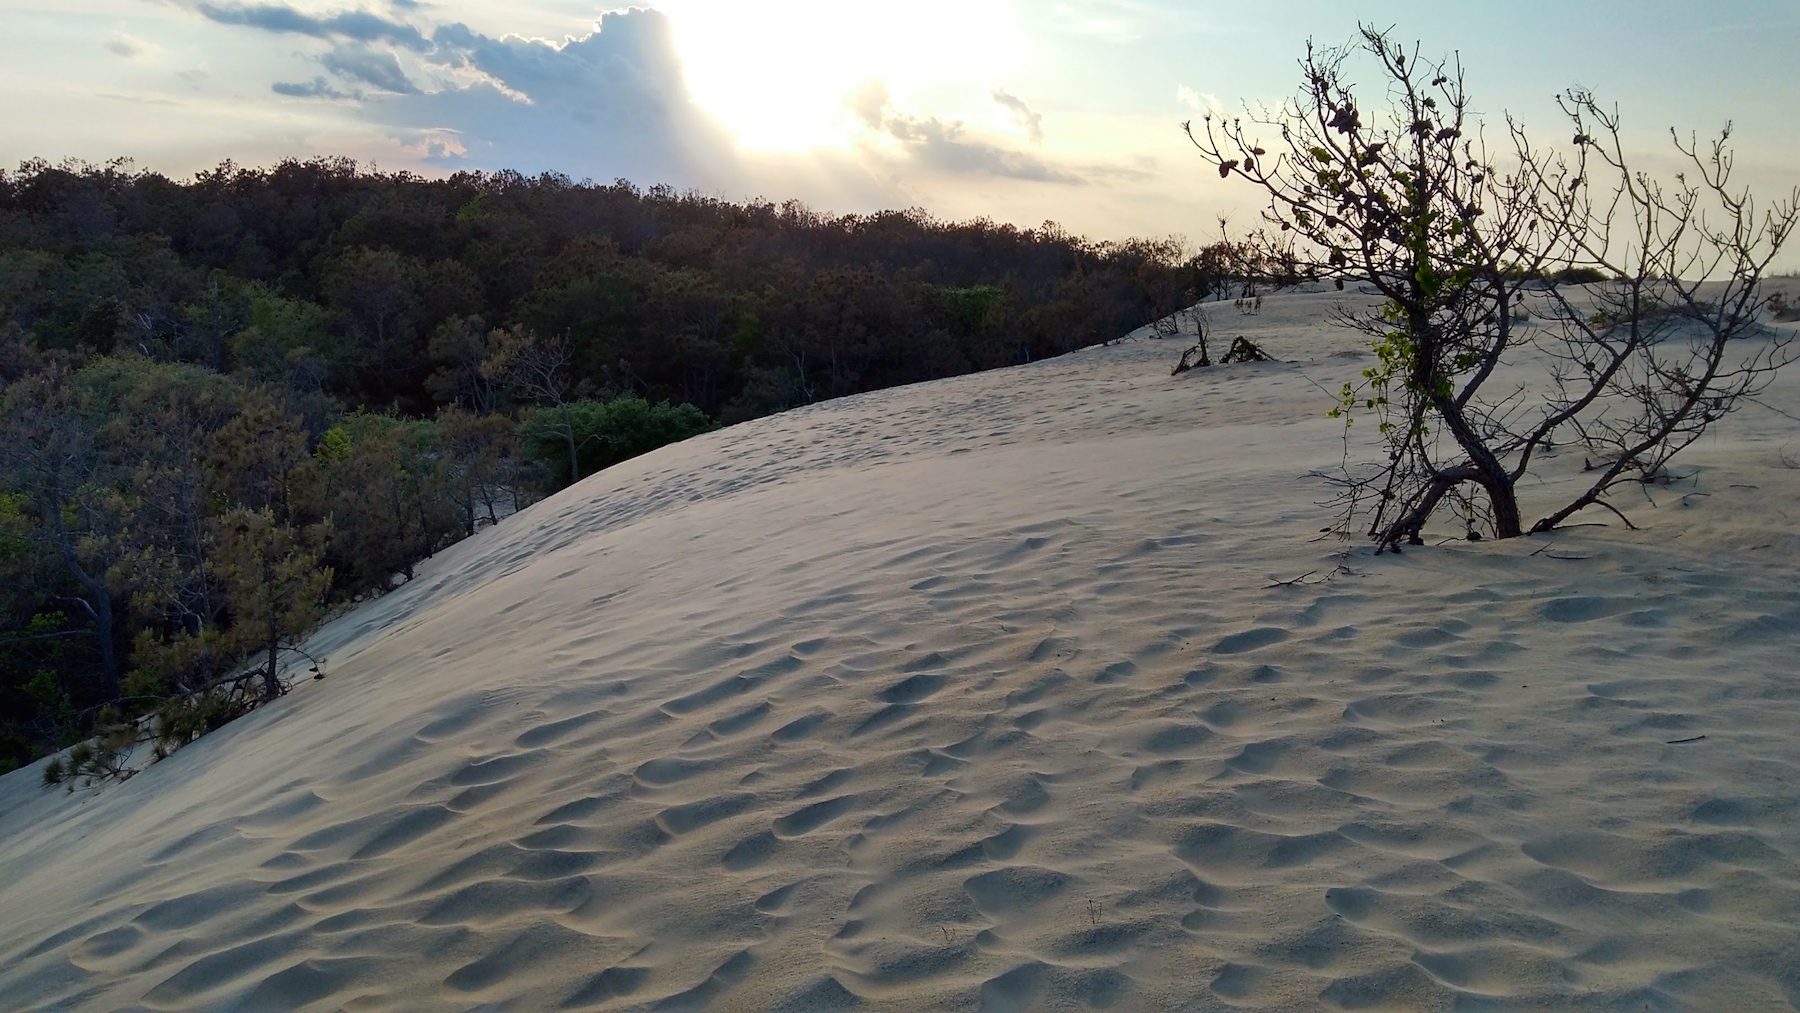
Vegetation
Vegetation has spread, but dune still kills trees on the leeward side
Sand volume
total sand volume is stable, but the core (sand that has not moved) is shrinking
Contours time series
Contours capture the landform change but they are hard to read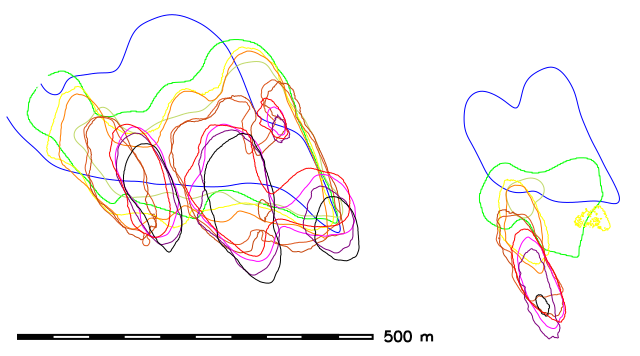 16m
16m
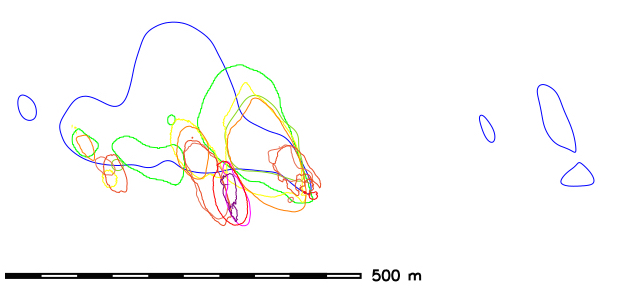 20m
20m
Space-Time cube visualization
DEM time series is converted into space-time voxel model in TGRASS and evolution of a contour is represented as isosurface: 16m and 20m
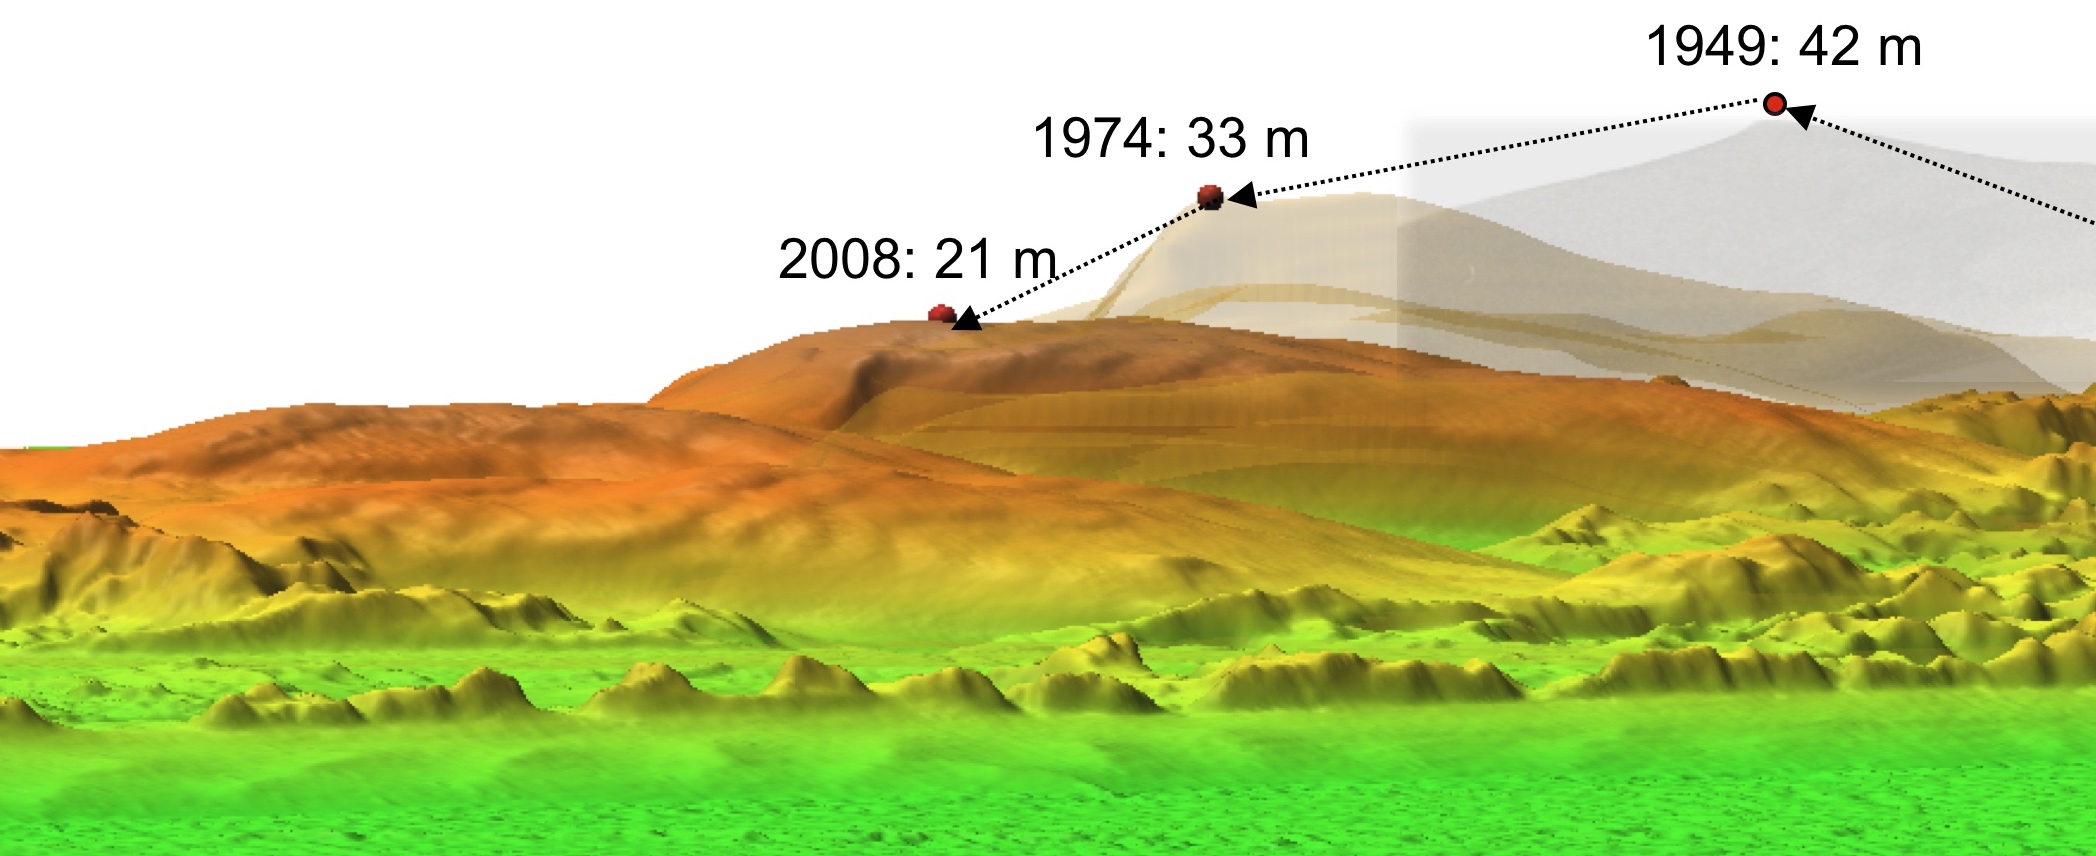
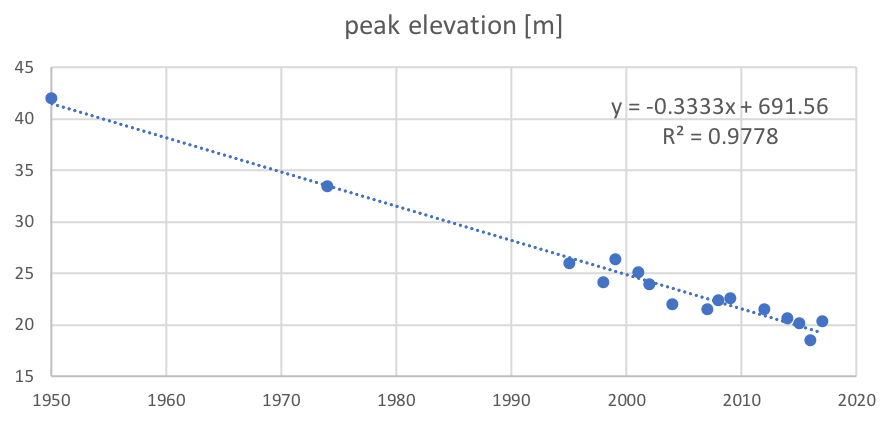
Peak elevation change
- linear trend in loss of peak elevation at 0.3 m/yr, from 43 m to 20 m
- accelerating horizontal migration from 3 m/yr to 6 m/yr
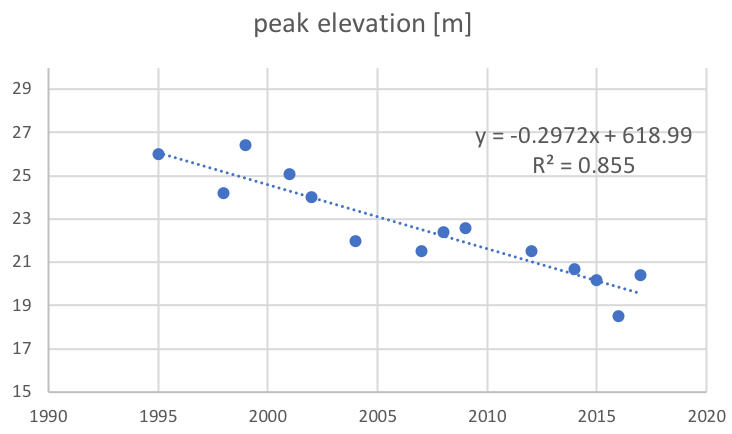
Peak elevation change
- linear trend in loss of peak elevation at 0.3 m/yr, from 43 m to 20 m
- accelerating horizontal migration from 3 m/yr to 6 m/yr
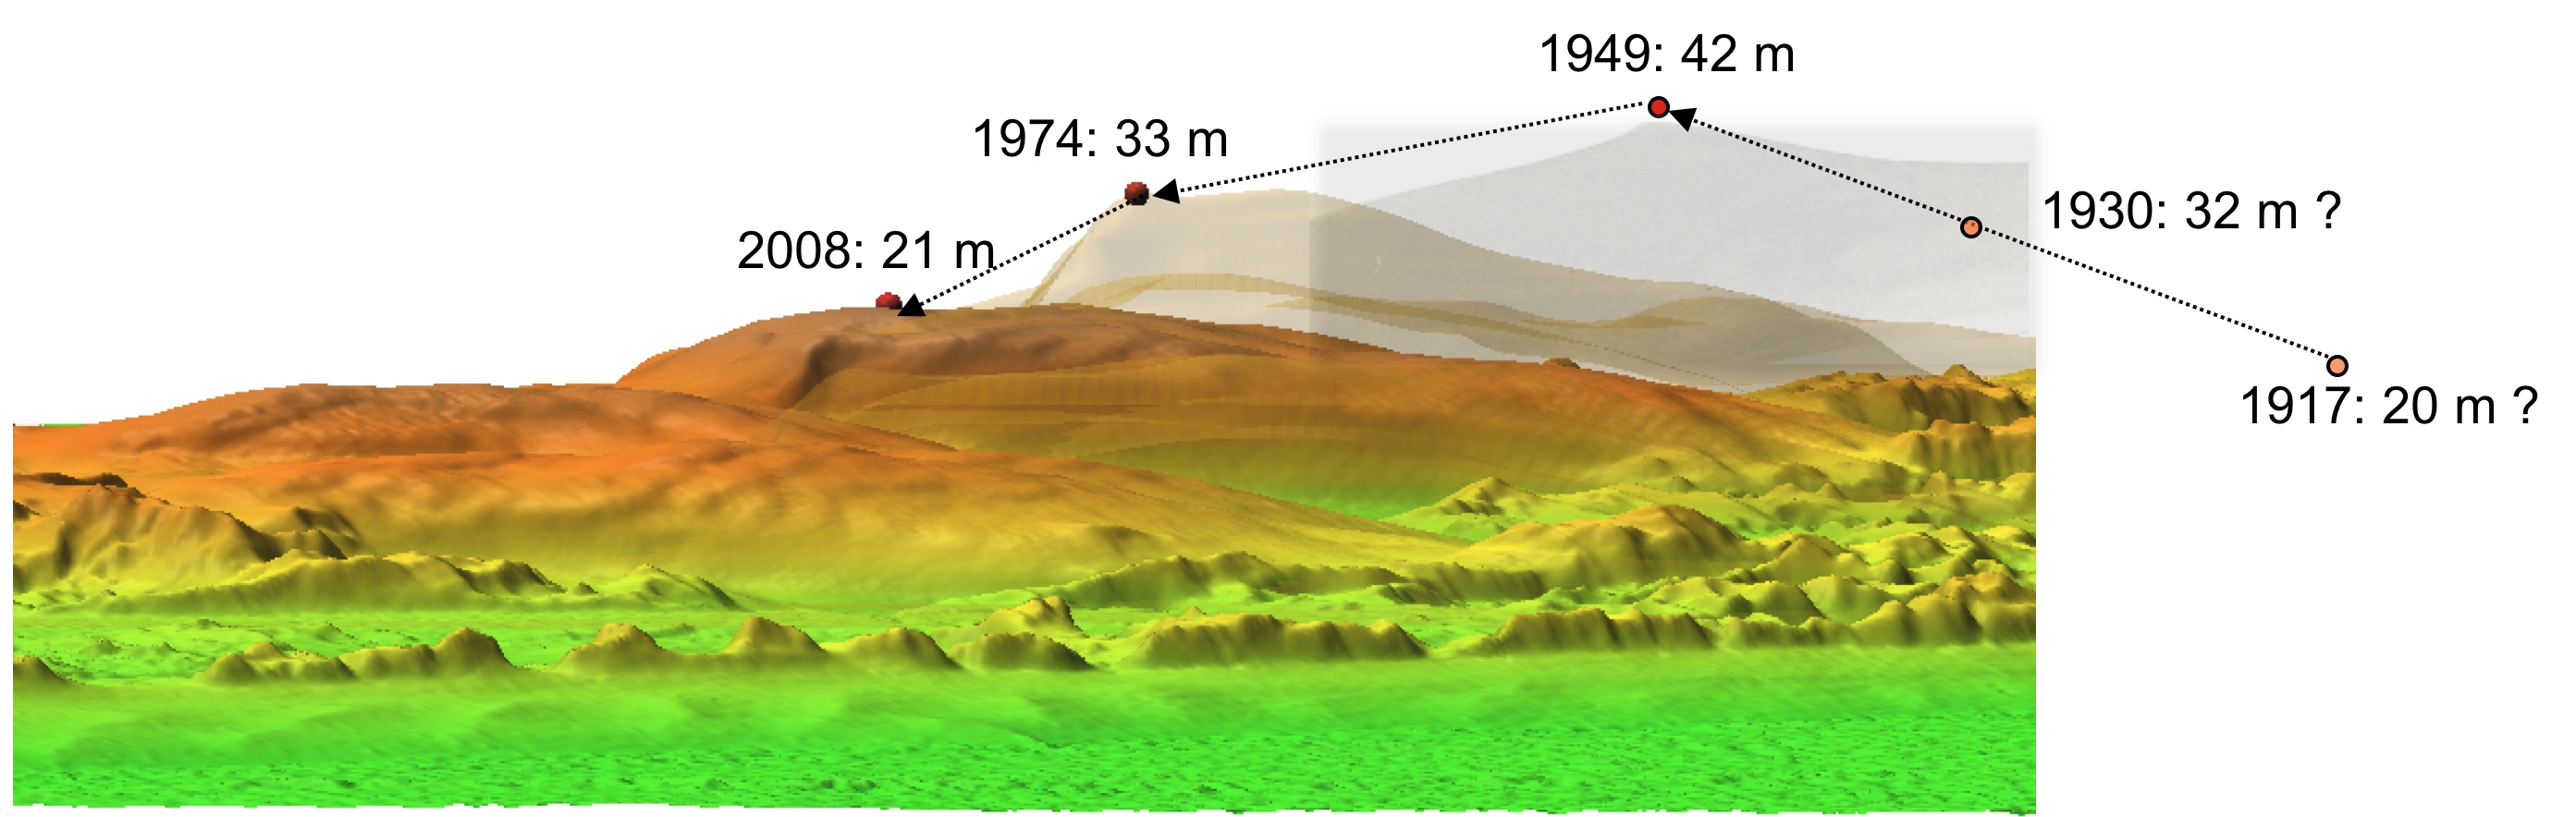
Jockey's Ridge story
The 43 m high dune was a transient landform,
transitioned between forest and active dunes over the past 2000 years
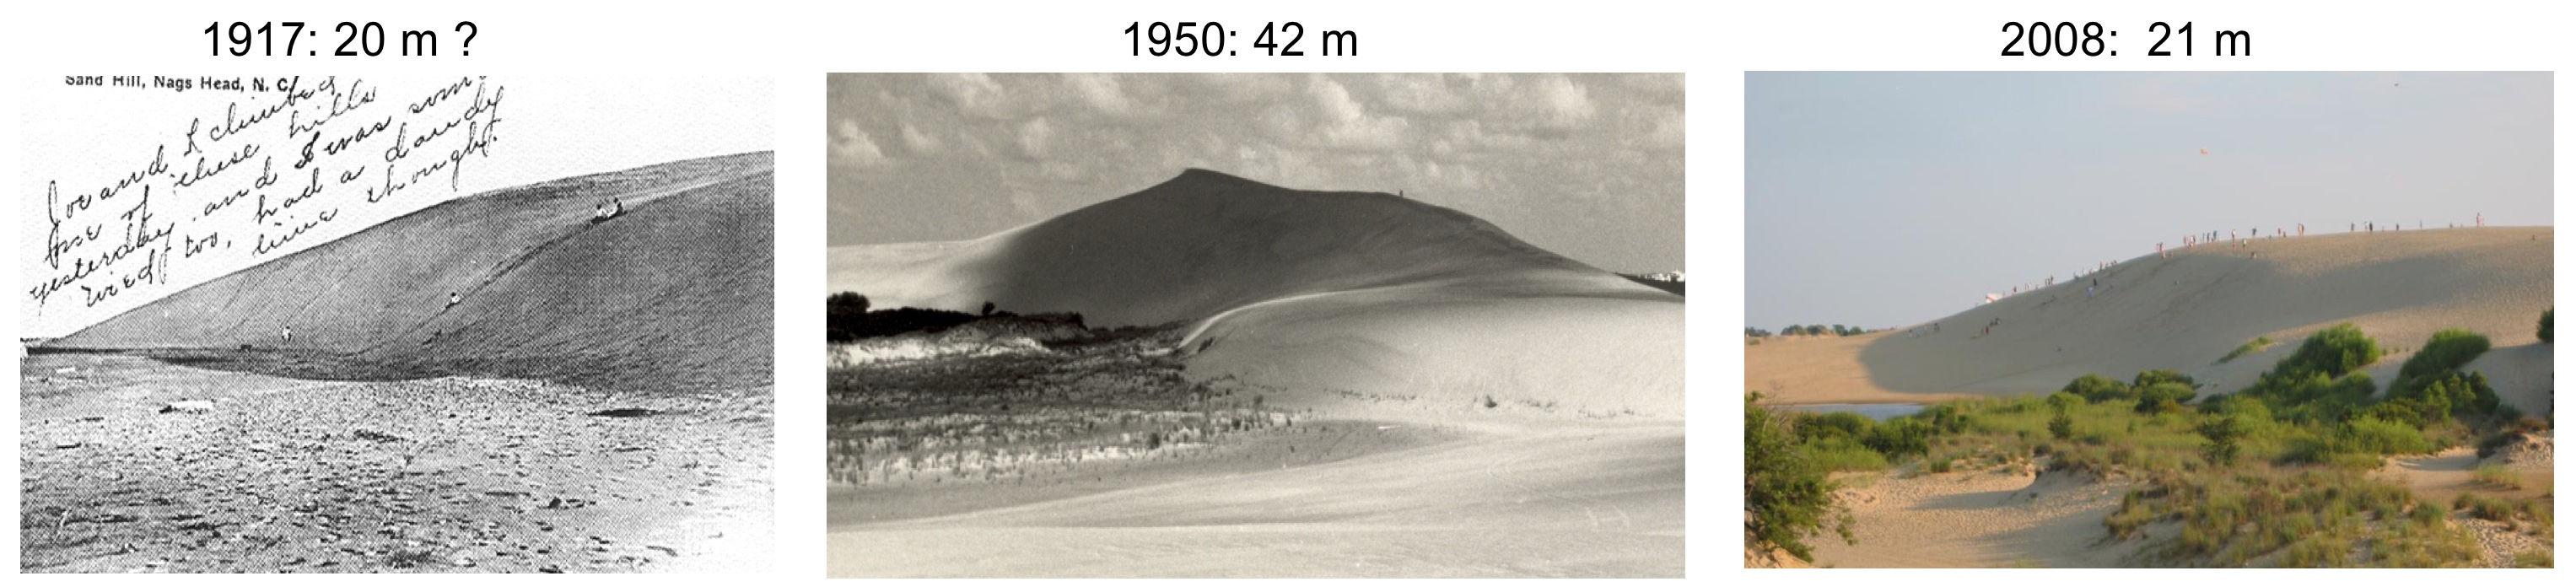
Dune in early 1900 and in 2008, 2016
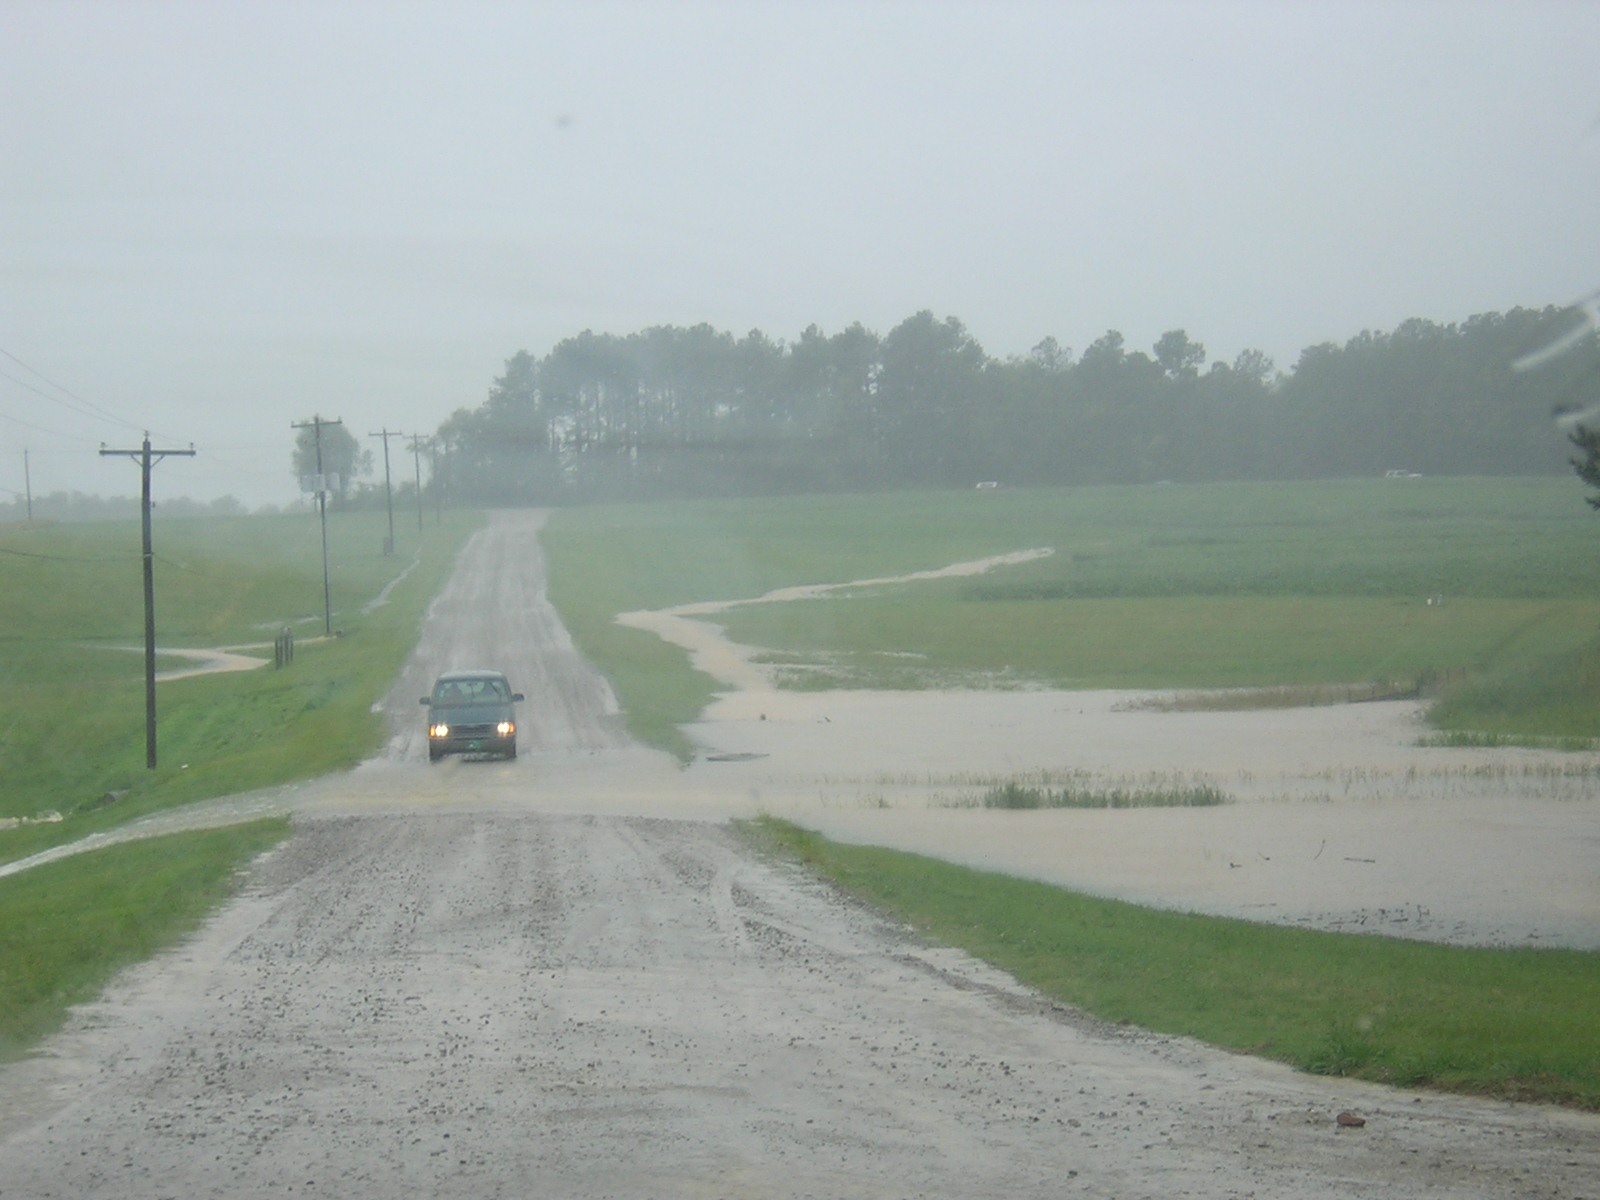
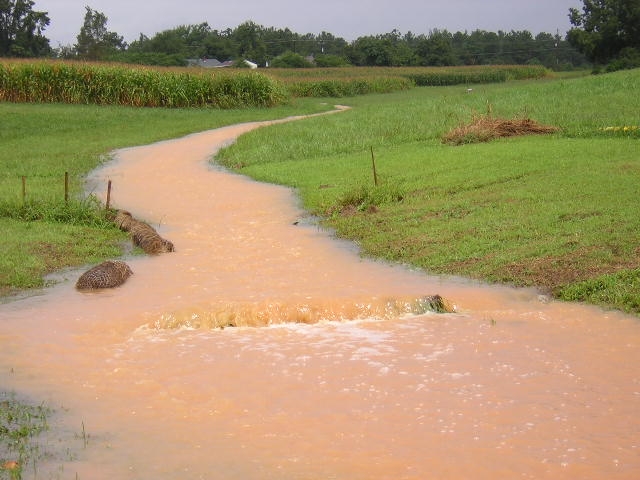
From observations to modeling of processes
Surface water flow, storm surge
Elevation surface controls water flow across landscapes
Critical processes and impacts: surface runoff, flooding, storm surge
Modeling surface water flow at high resolutions
- Challenging problem: complex, noisy surfaces, many real nested depressions
- Path sampling: stochastic method based on duality of particles and fields
Mitasova, H., Thaxton, C., Hofierka, J., McLaughlin, R., Moore, A., Mitas L., 2005, Path sampling method for modeling overland water flow, sediment transport and short term terrain evolution in Open Source GIS. In: C.T. Miller, M.W. Farthing, V.G. Gray, G.F. Pinder eds., Proceedings of the XVth International Conference on Computational Methods in Water Resources (CMWR XV), June 13-17 2004, Chapel Hill, NC, USA, Elsevier, pp. 1479-1490.
High resolution water flow
Street level modeling of surface runoff using path sampling method
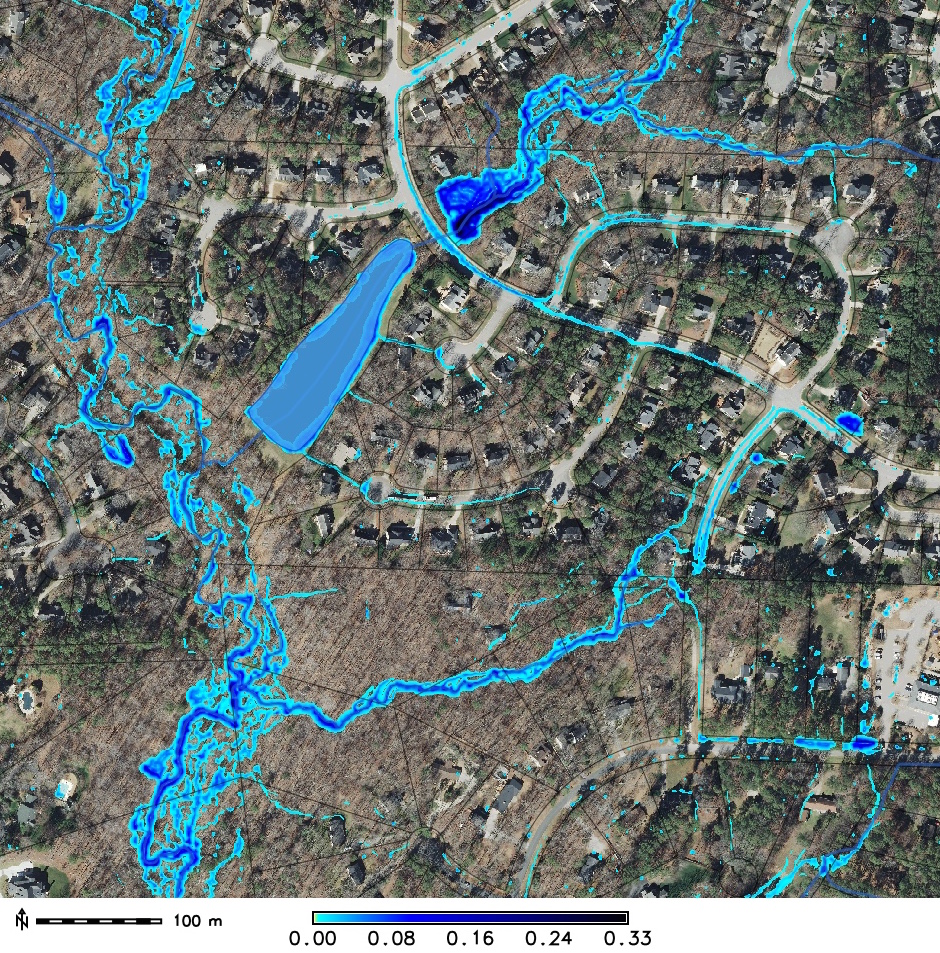
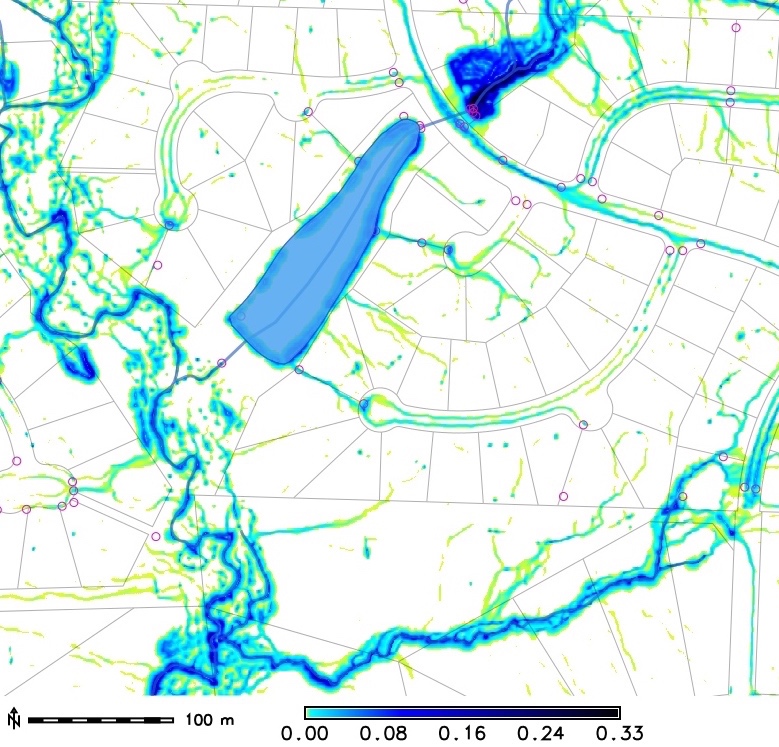
storm drains and stormwater pipes are in the map, only surface water flow is shown, izy model is coupled with SWM, but harder to run
Ultra-high resolution water flow: UAS mapping
Modeling impact of tillage and rills on surface water flow using 0.2m DEM derived by SfM based on UAS imagery
Modeling flooding extent
Students are making an impact
Project-based graduate courses since 2008
Integration of open source GIS in courses
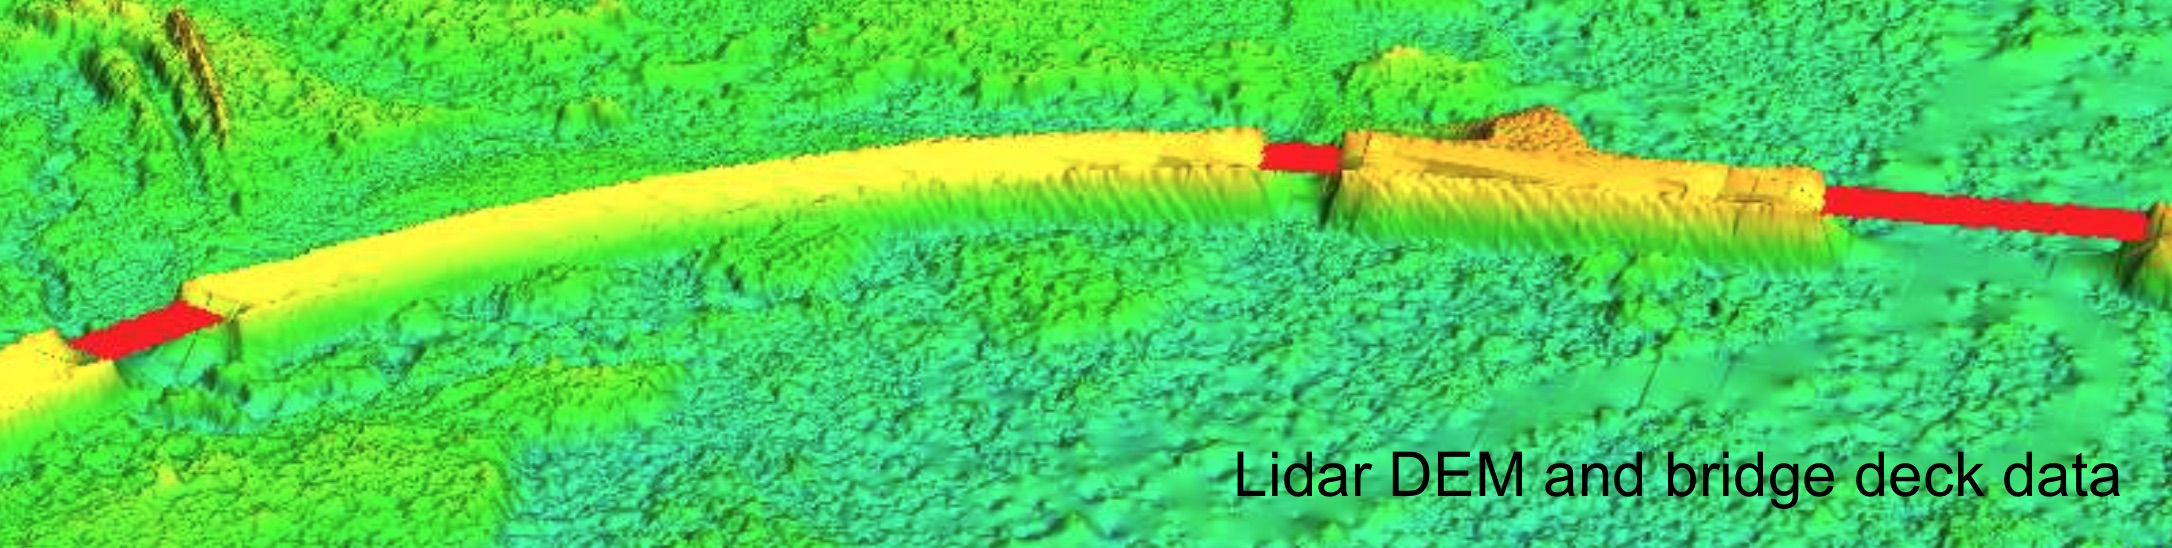
Onset of bridge flooding
William Ross for NC disaster management
Bridges are cut out in lidar DEM to facilitate water routing,
bridge deck polygon data were used to add bridges back to lidar DEM
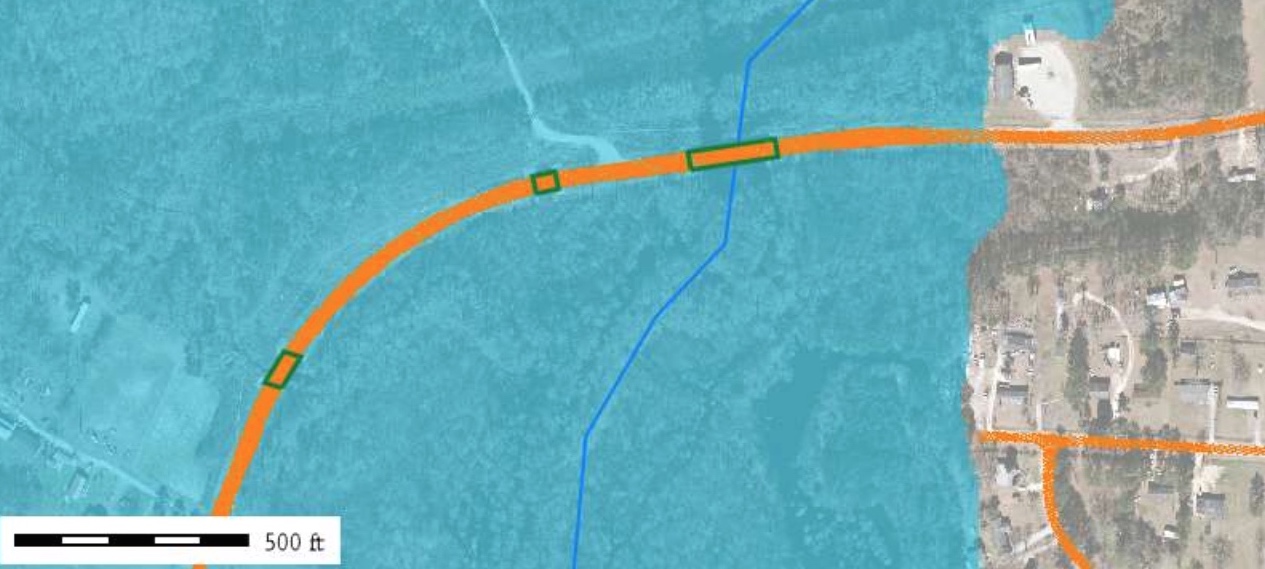
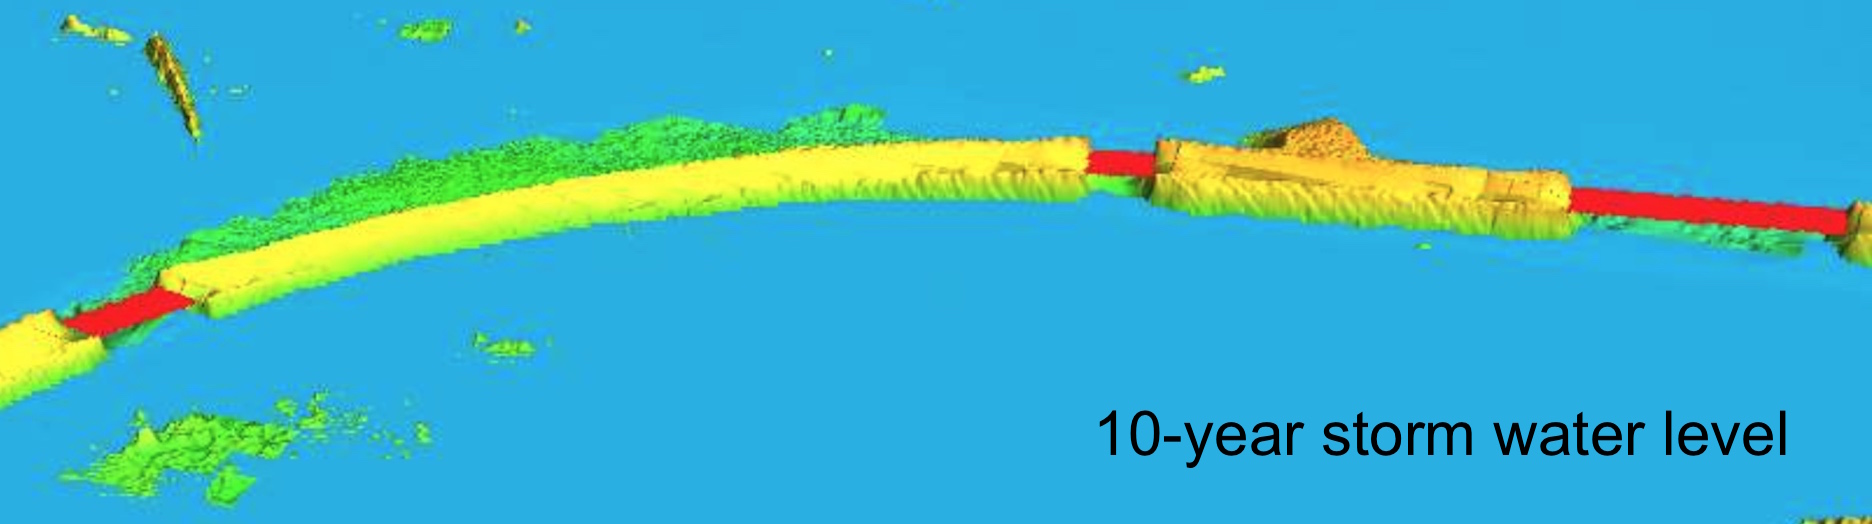
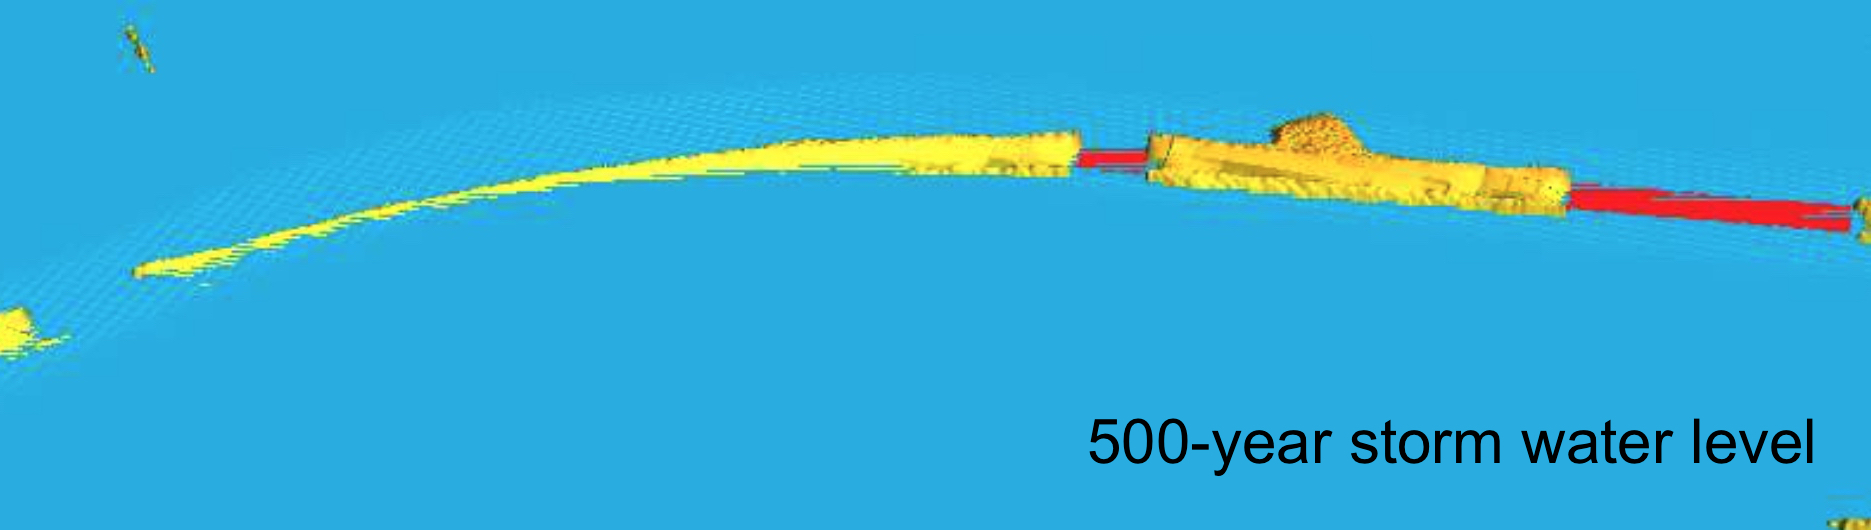
Onset of bridge flooding
William Ross for NC disaster management
Flood level was modeled using floodplain mapping data for 10, 100, 500 year storm
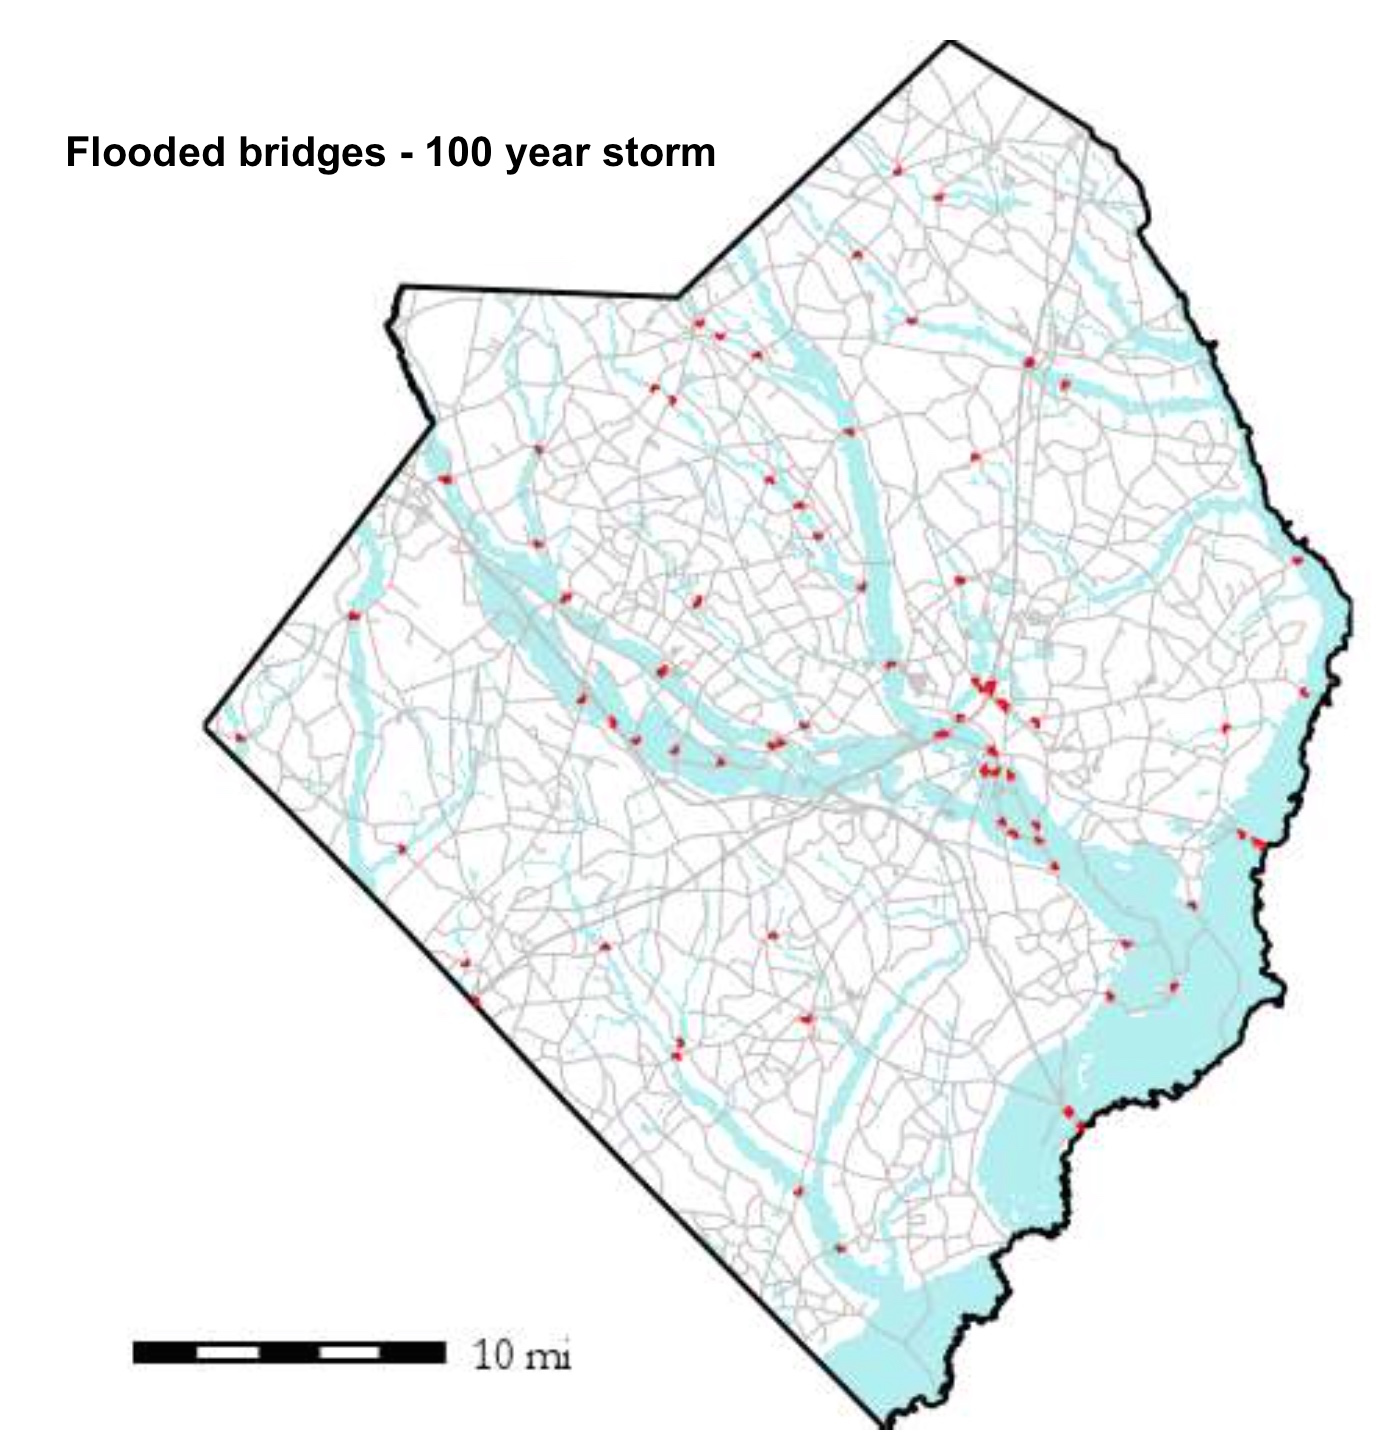
County map of flooded bridges
Flooded bridges mapped based on lidar, bridge and inundation data for 100 yr storm
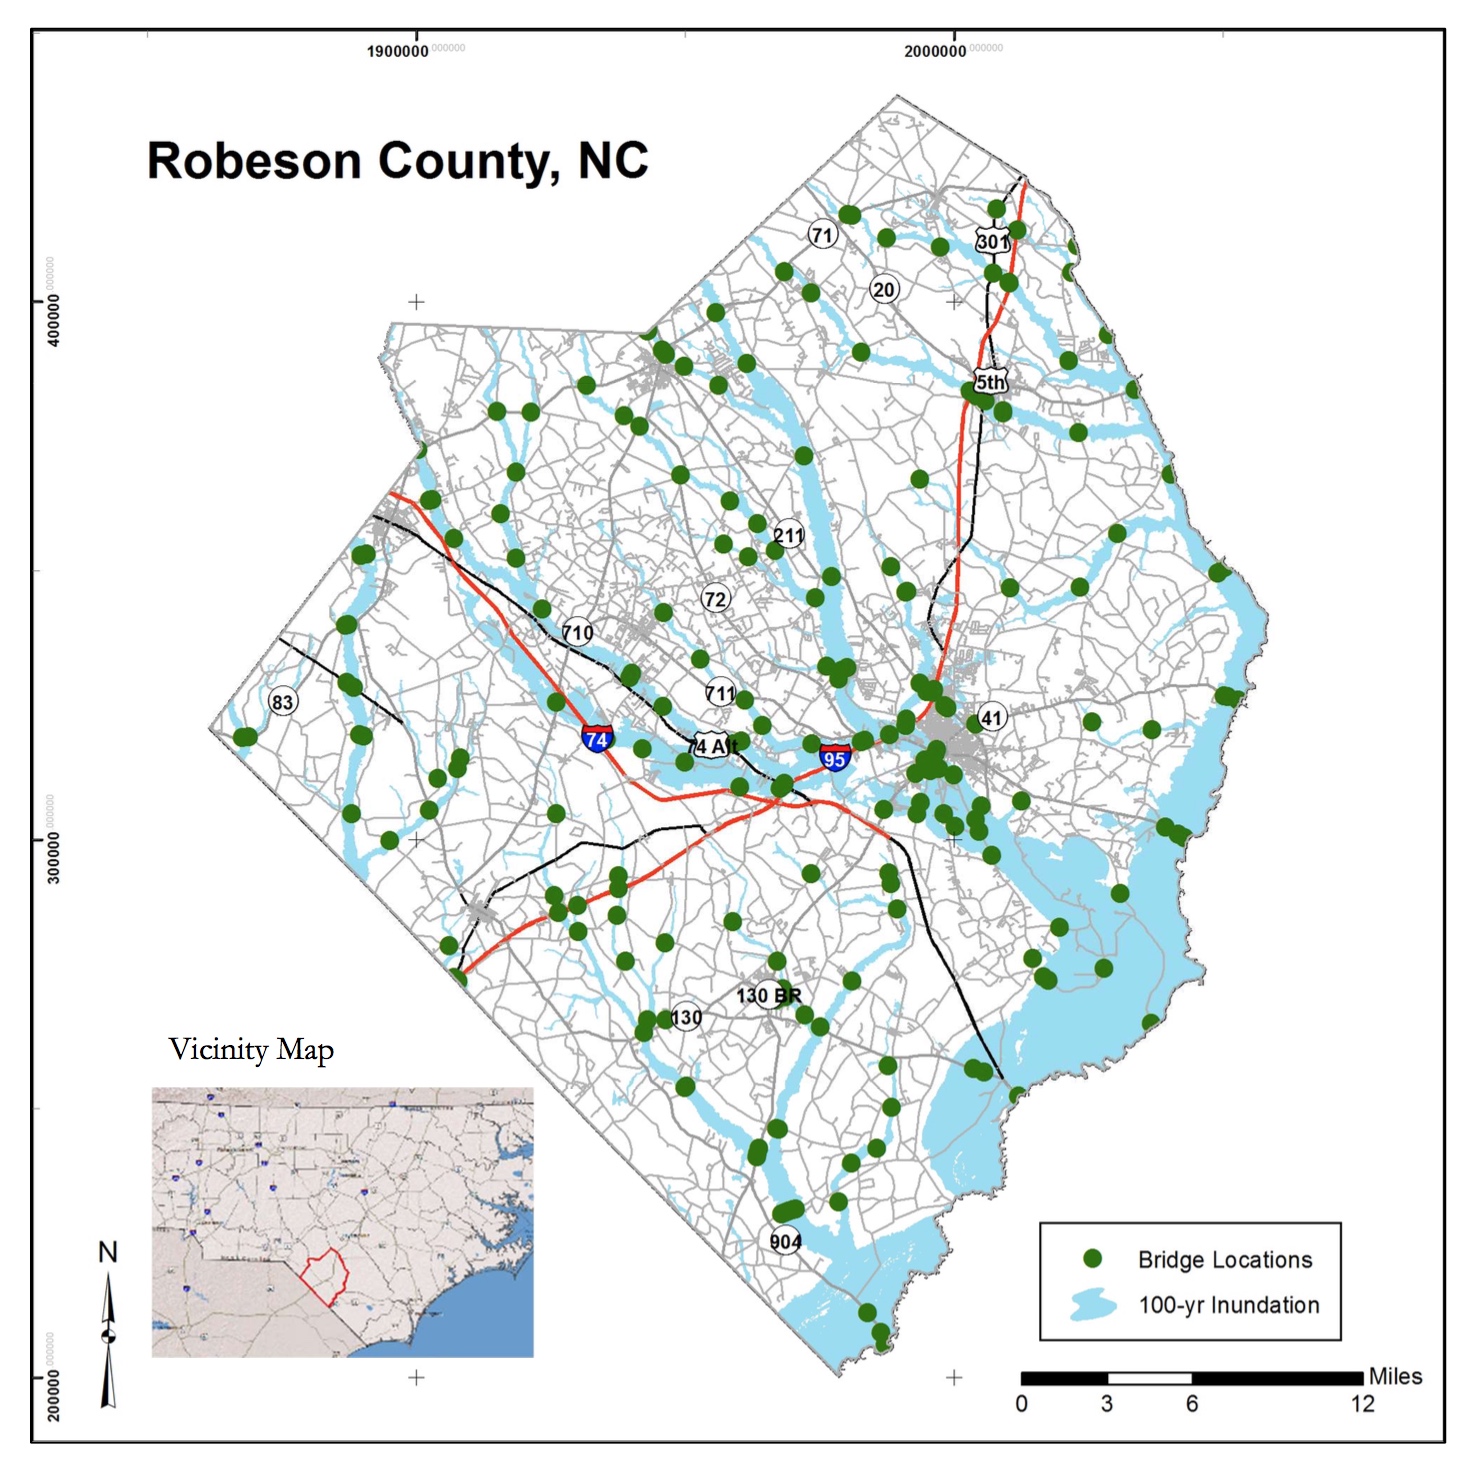
Lumberton river at Lumberton in Robeson county, at intersection of I-95 and I-74
Flooded I-40 after hurricane Florence
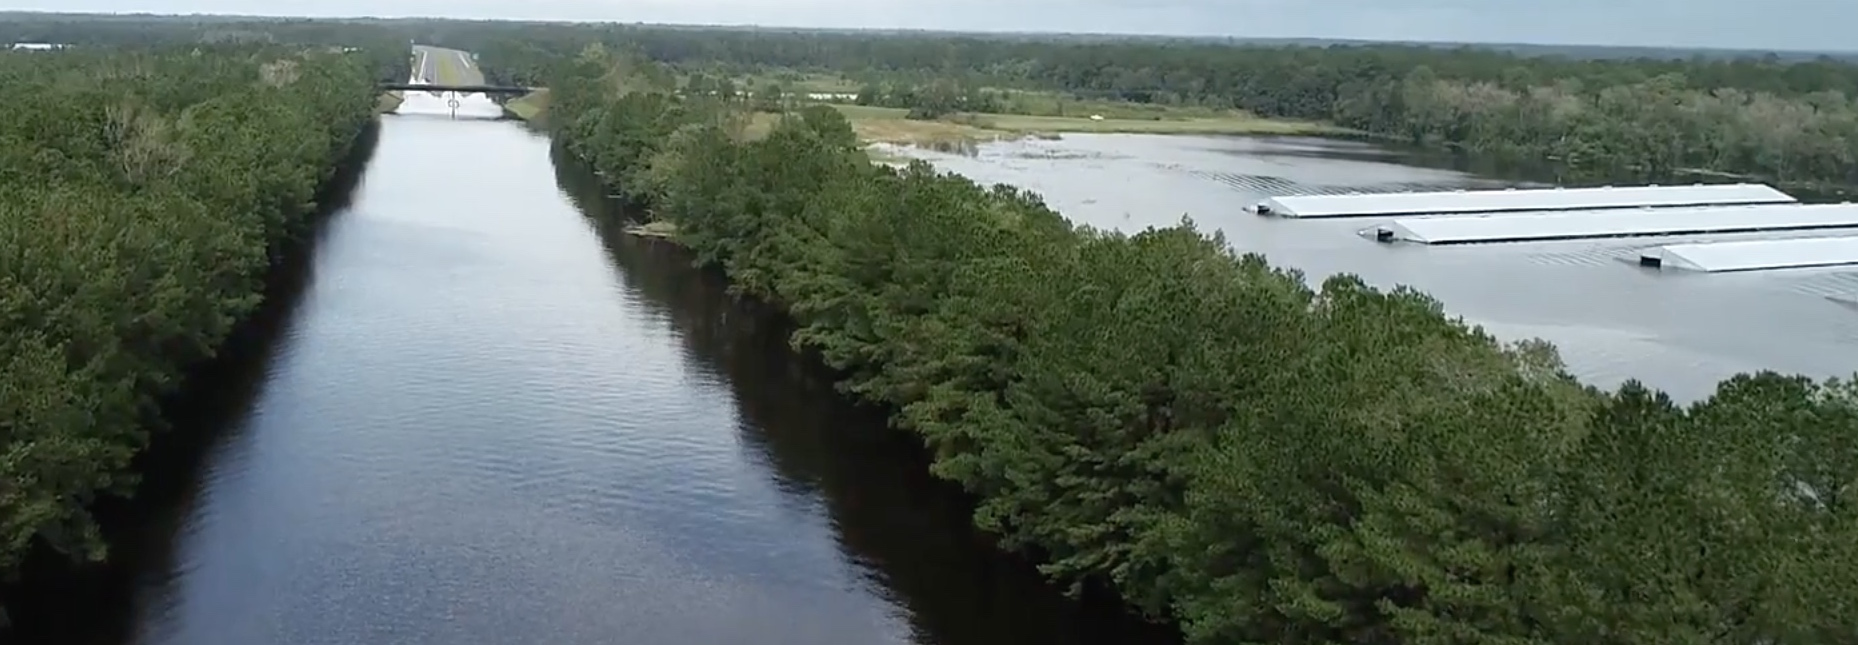
I-40 as a river in NCDOT drone video
2016 hurricane Mathews - use of drones was exploratory
2018 hurricane Frances - drones were in full servicei: assess flood conditions and structural damage, look for trapped people
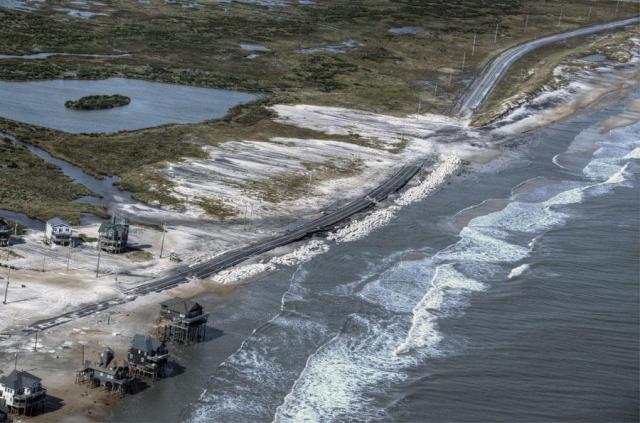
Storm surge coastal flooding
High resolution data capture the vulnerable terrain features
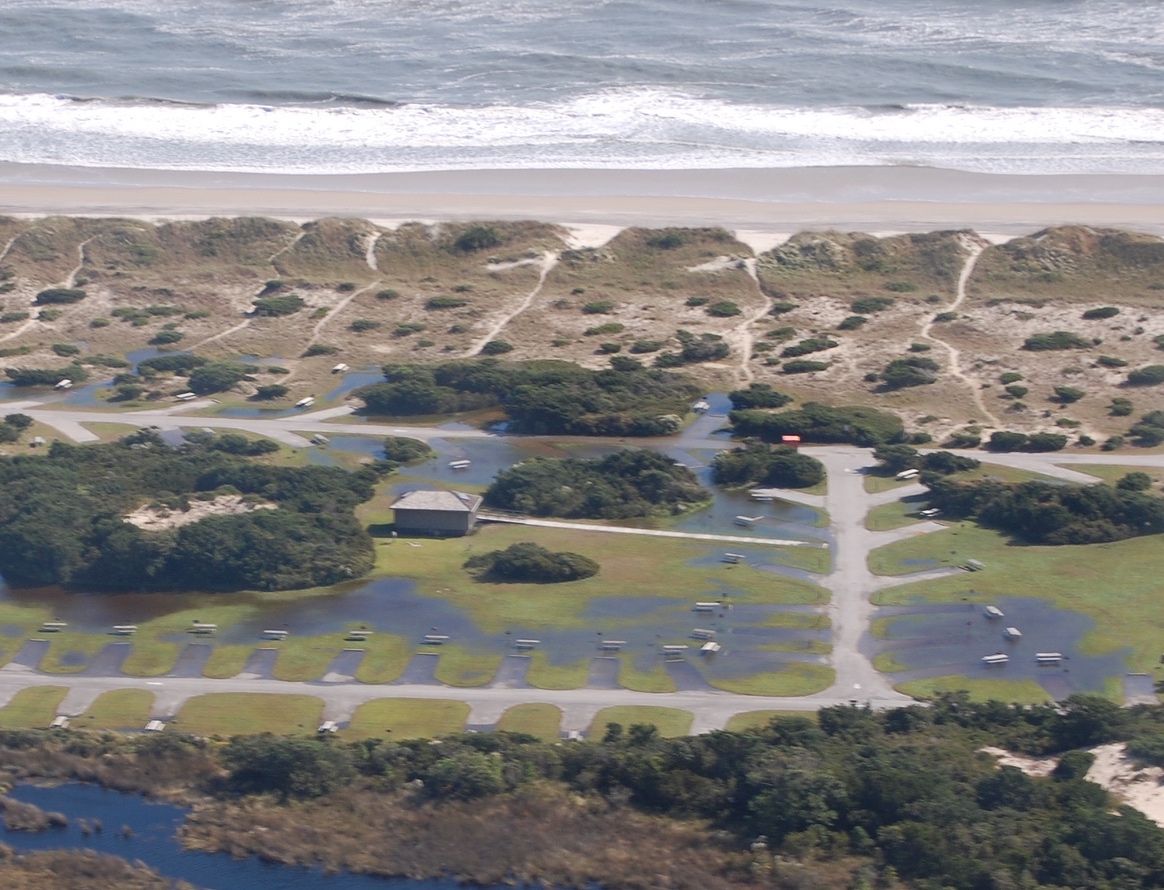
Simplified, geometry-based approach spreads water level from process-based model prediction at high resolution
Improving storm surge flooding predictions
Nelson Tull for operational storm surge prediction using ADCIRC
Hurricane Matthew Hindcast - number of buildings flooded: before enhancement: 2435;
after: 3886, a 60 percent increase.
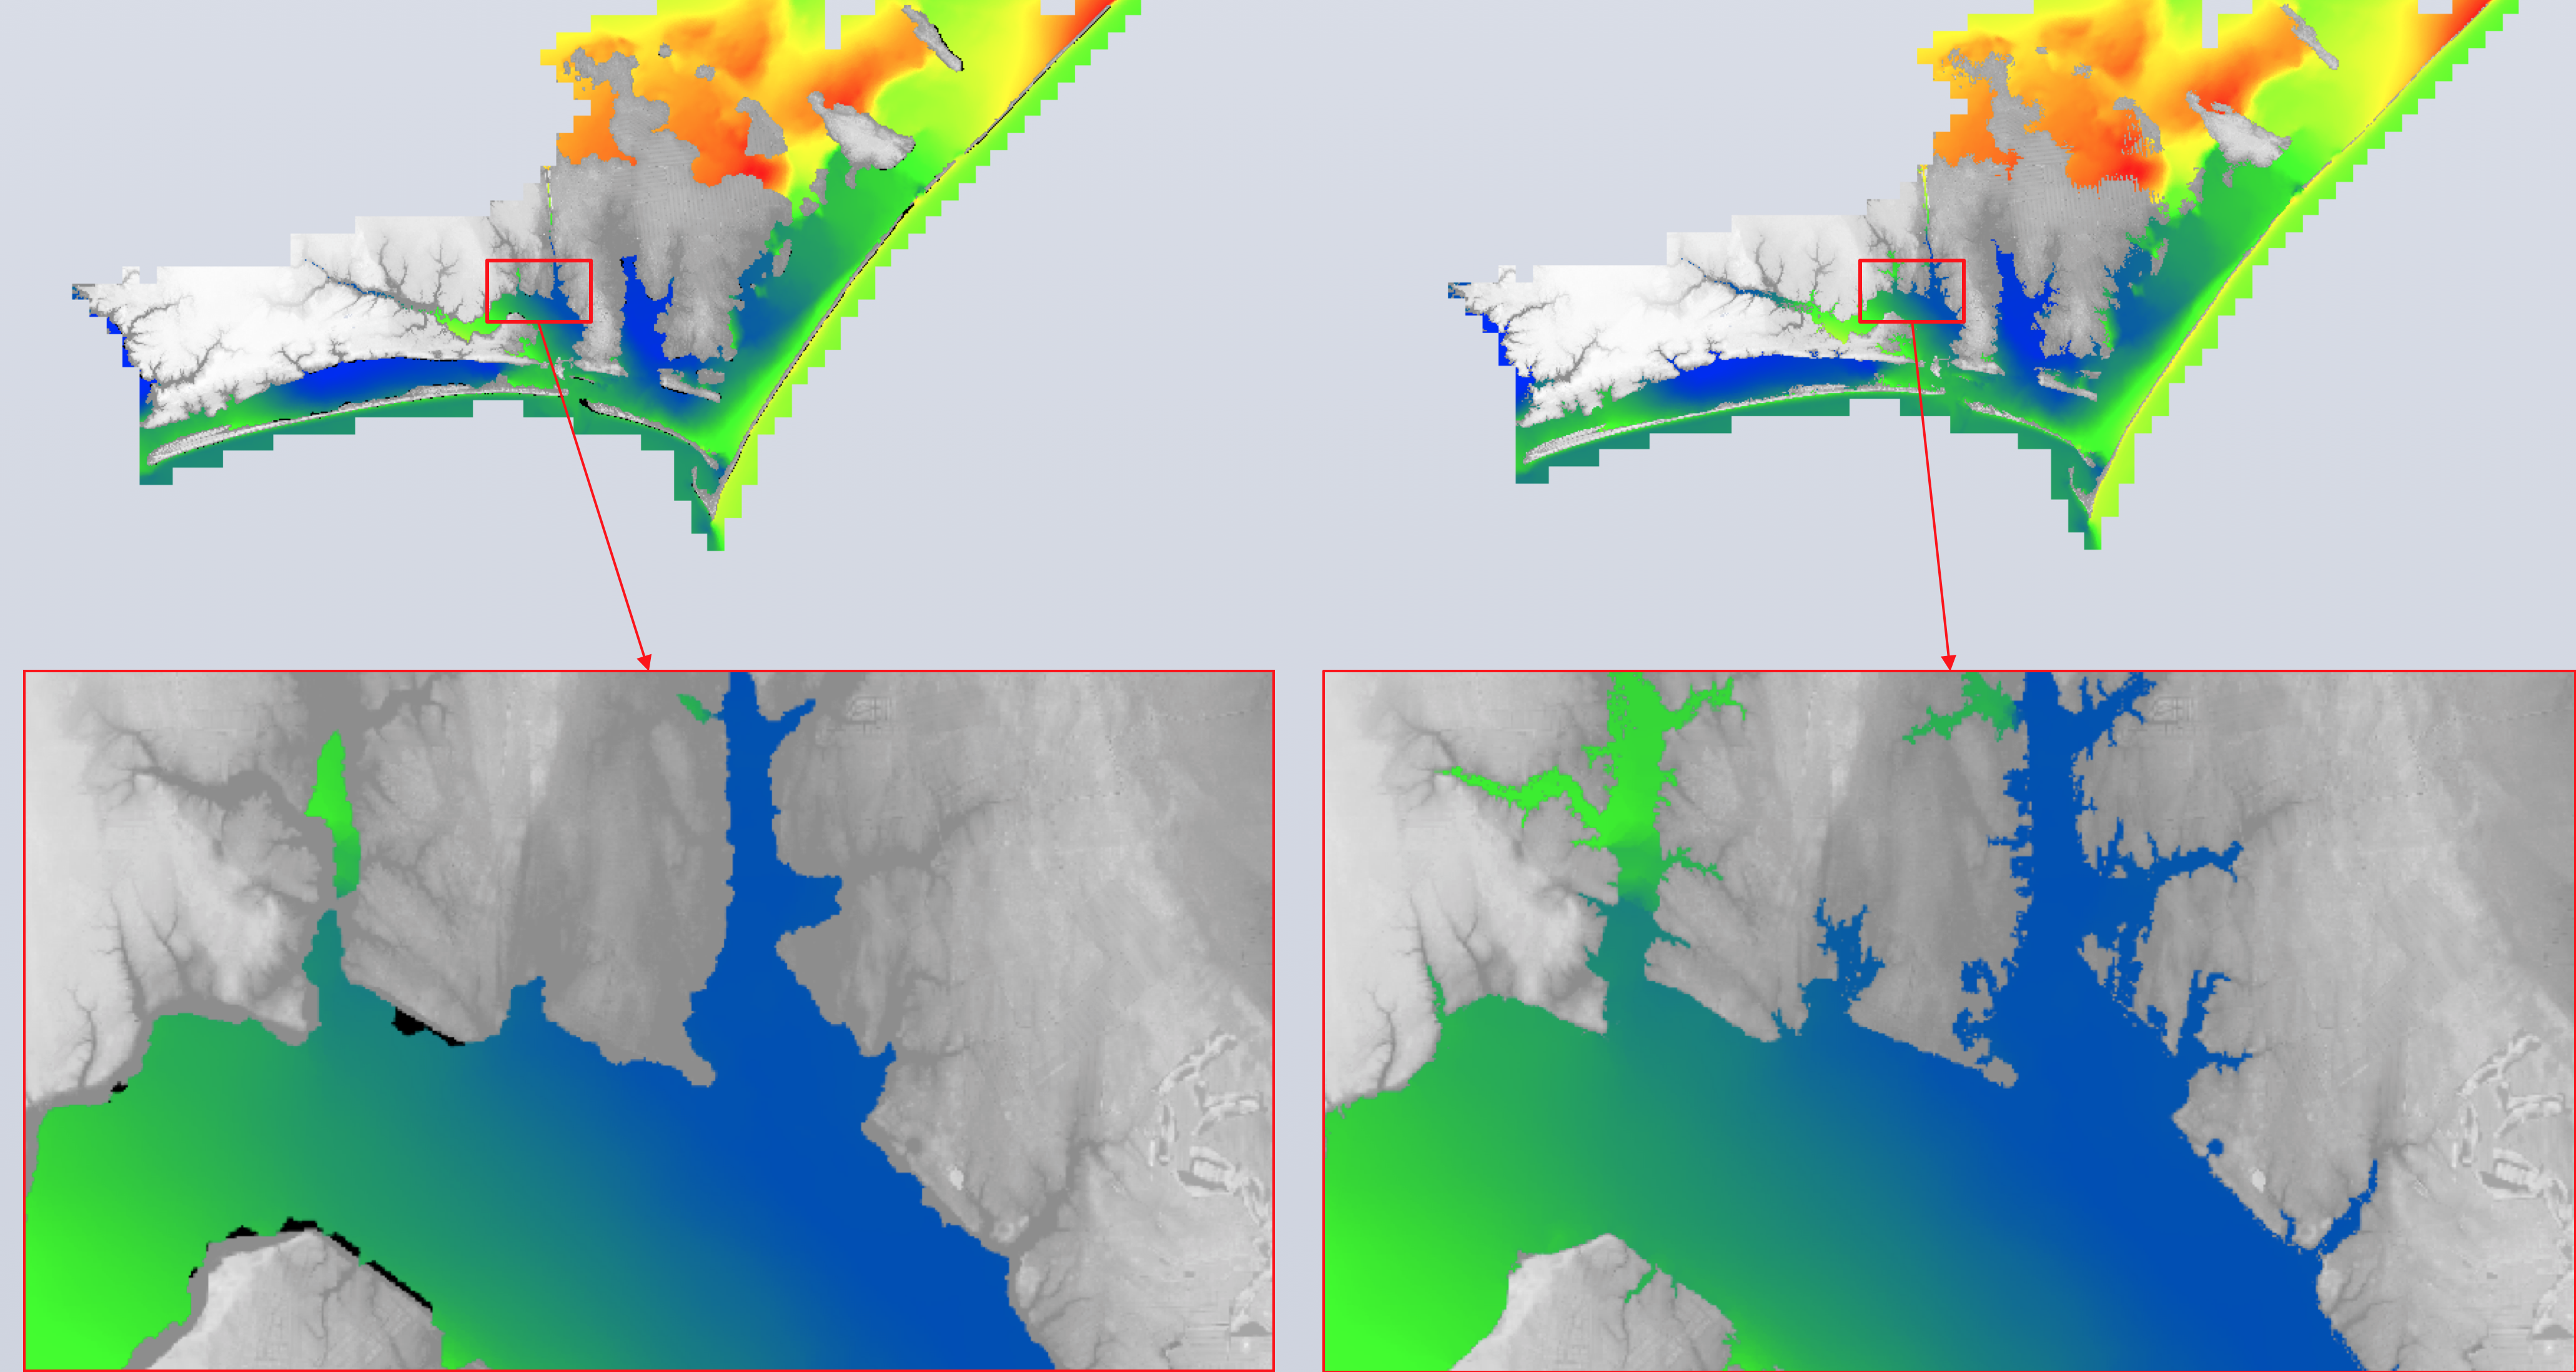
N. Tull, J.C. Dietrich, T.E. Langan, H. Mitasova, B.O. Blanton, J.G. Fleming, R.A. Luettich 2018, Improving Accuracy of Real-Time Storm Surge Inundation Predictions Using GRASS GIS, Poster at ASBPA conference, October 2017. (American Shore and Beach Preservation Association)
Beyond bare earth surface
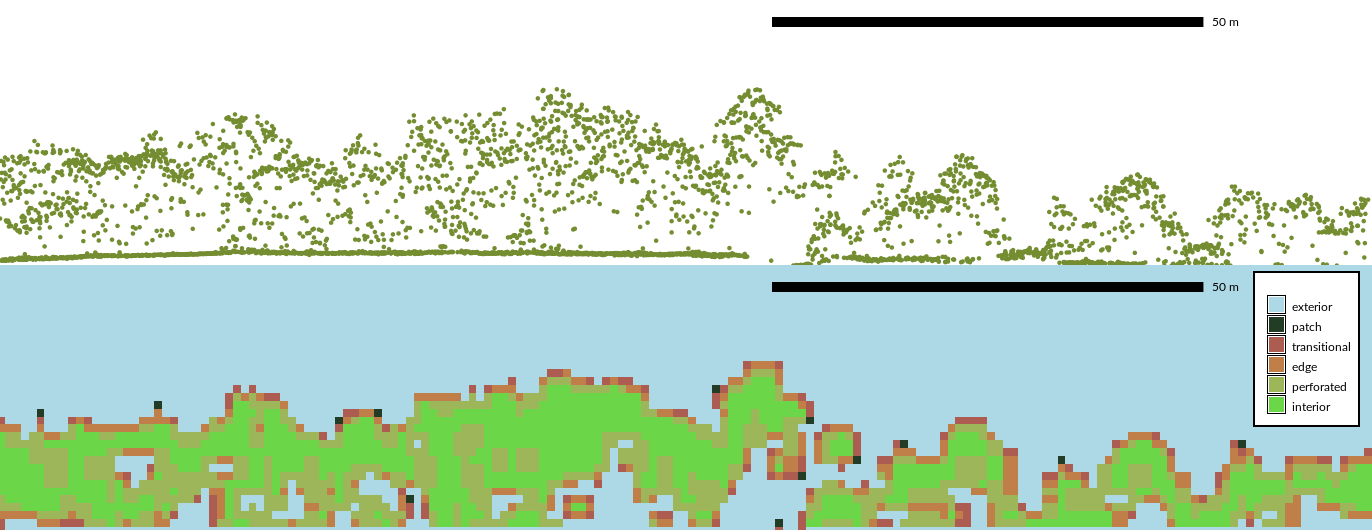
Vegetation structure from multiple return lidar
Vaclav Petras PhD research project
Generalized Fragmentation Index derived from 3D grid point counts: vertical slice of raw point cloud and slice of fragmentation index 3D raster
Vegetation voxel models
Slicing through fragmentation index 3D raster
 Petras, V., D. J. Newcomb, and H. Mitasova. 2017. Generalized 3D fragmentation index derived from lidar point clouds. In: Open Geospatial Data, Software and Standards 2(9). DOI 10.1186/s40965-017-0021-8
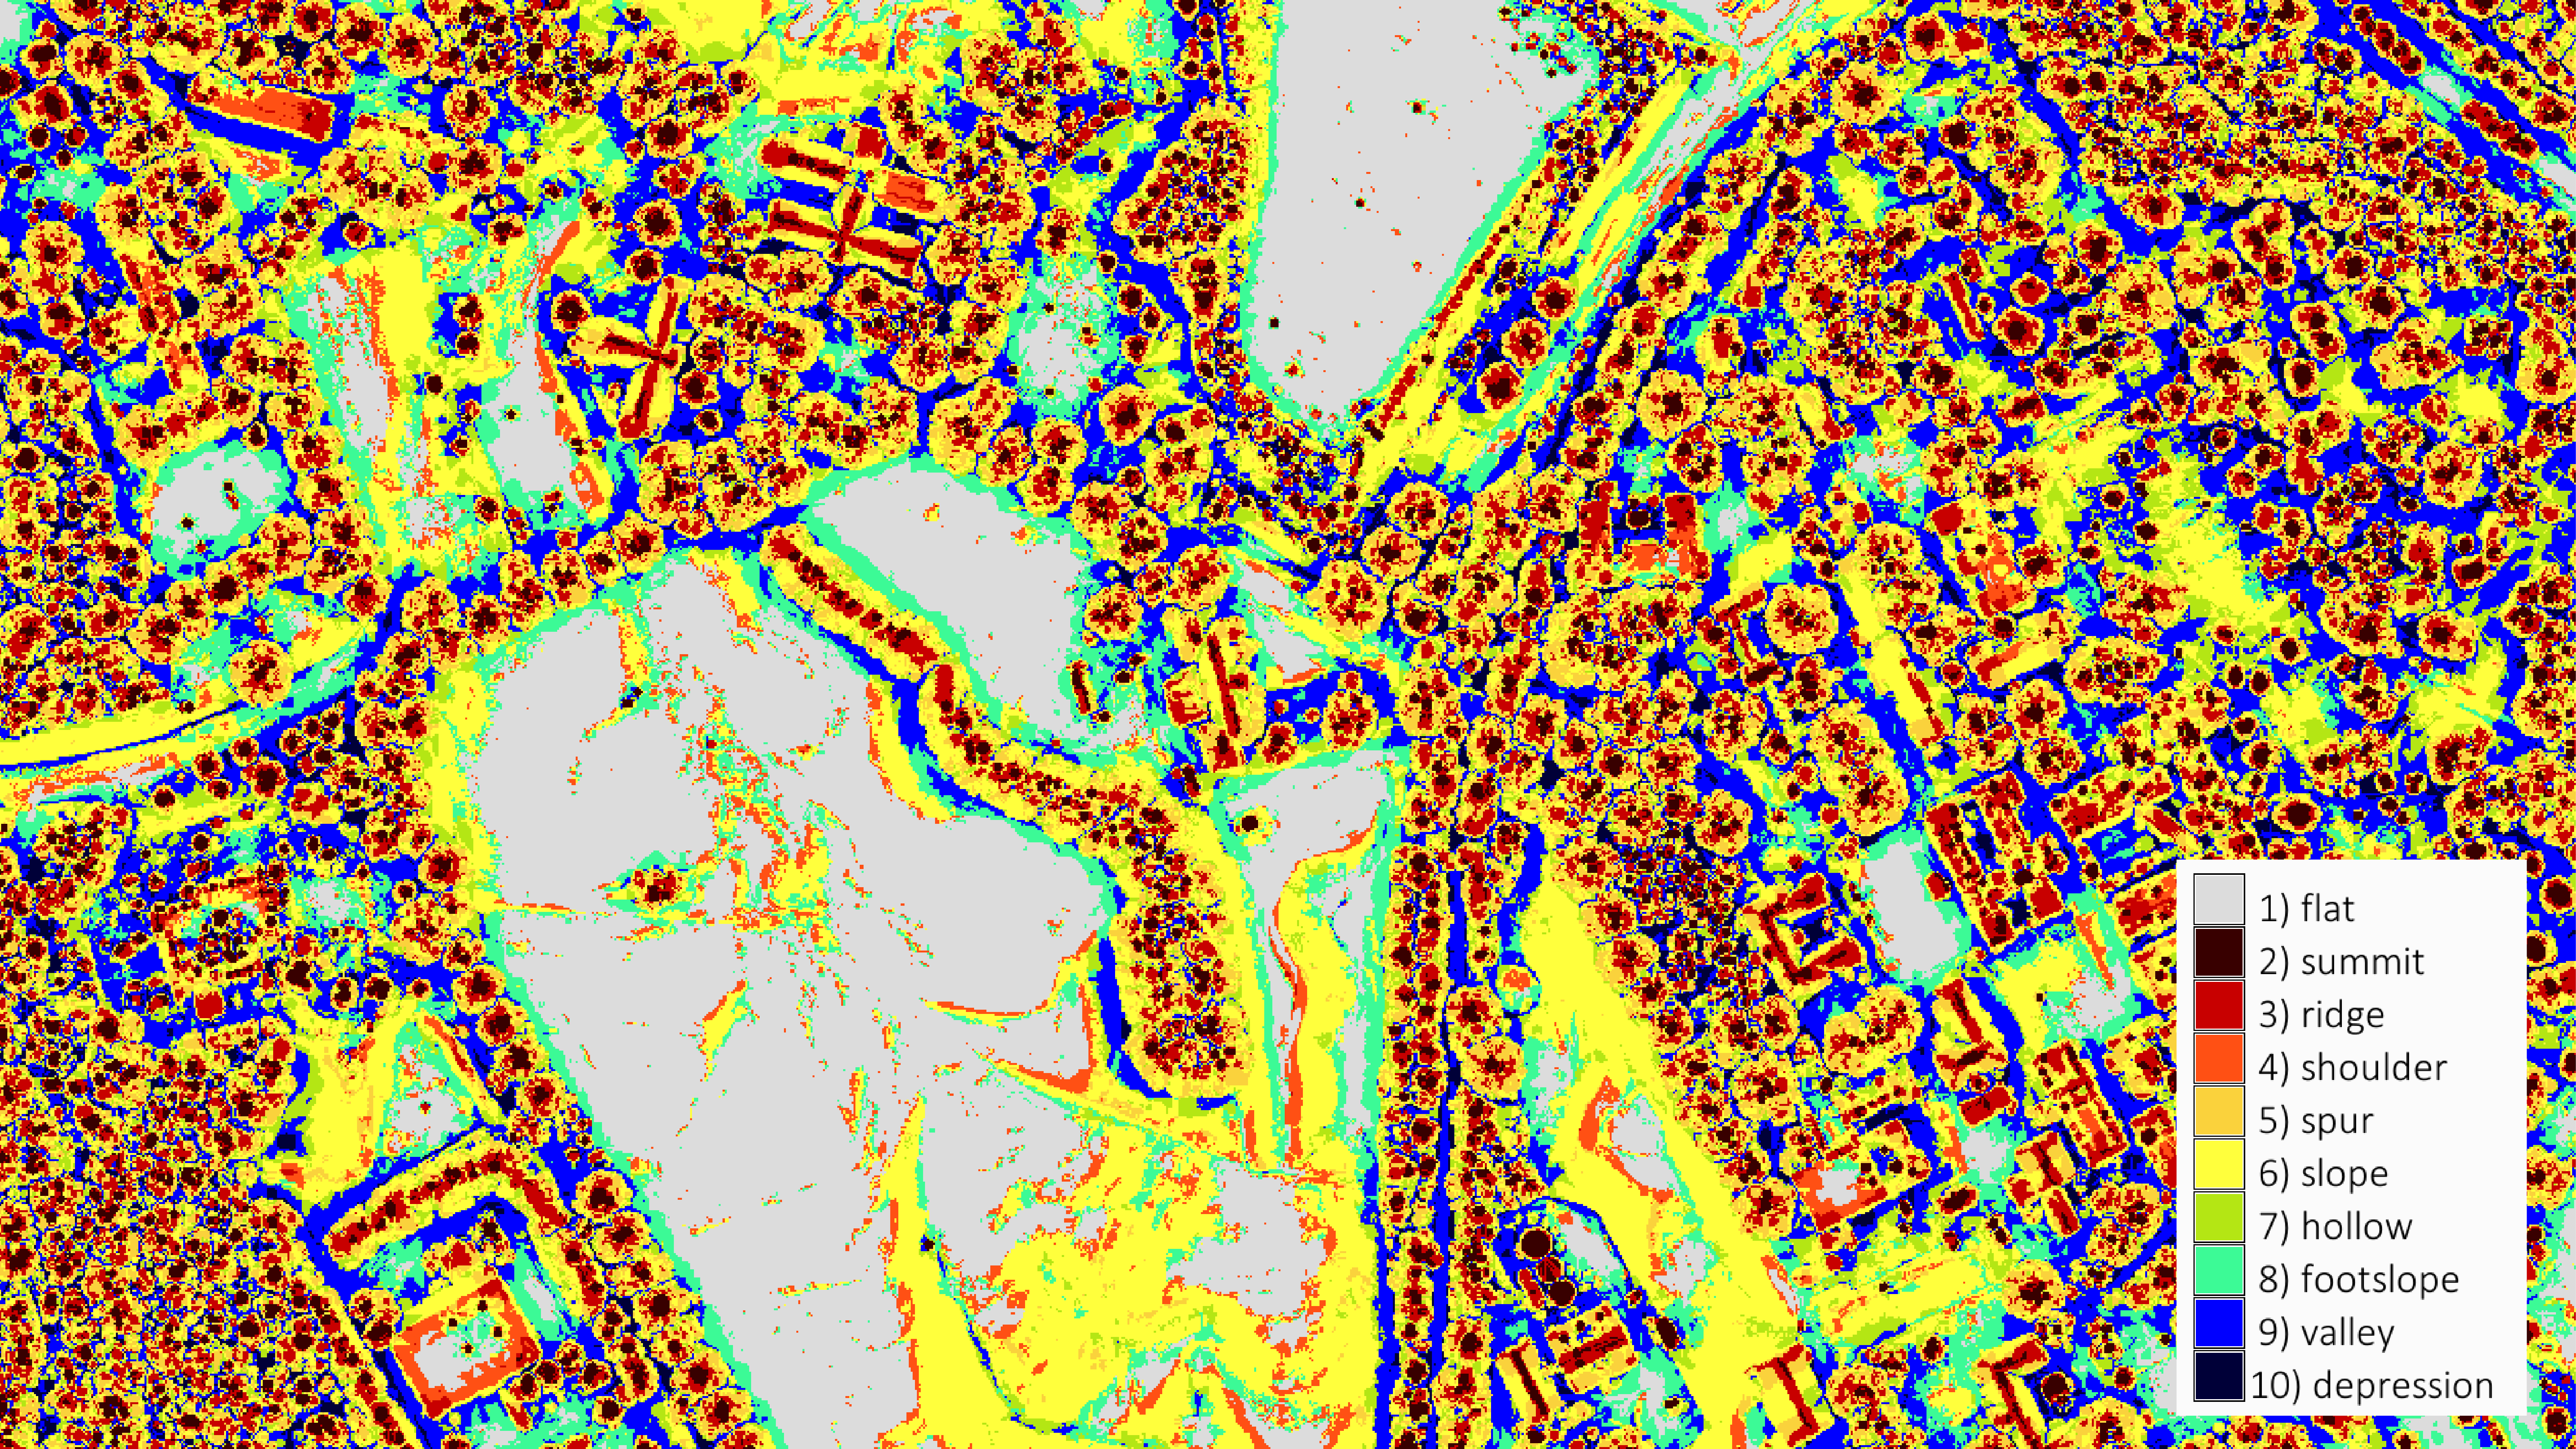
Individual tree detection from lidar
Payam Tabrizian PhD research project
- Geomorphons (Jasiewicz, Stepinski 2013) applied to vegetation surface: summits represent individual trees.
- Detected deciduous trees are replaced by modeled trunks to improve accuracy of viewscape analysis
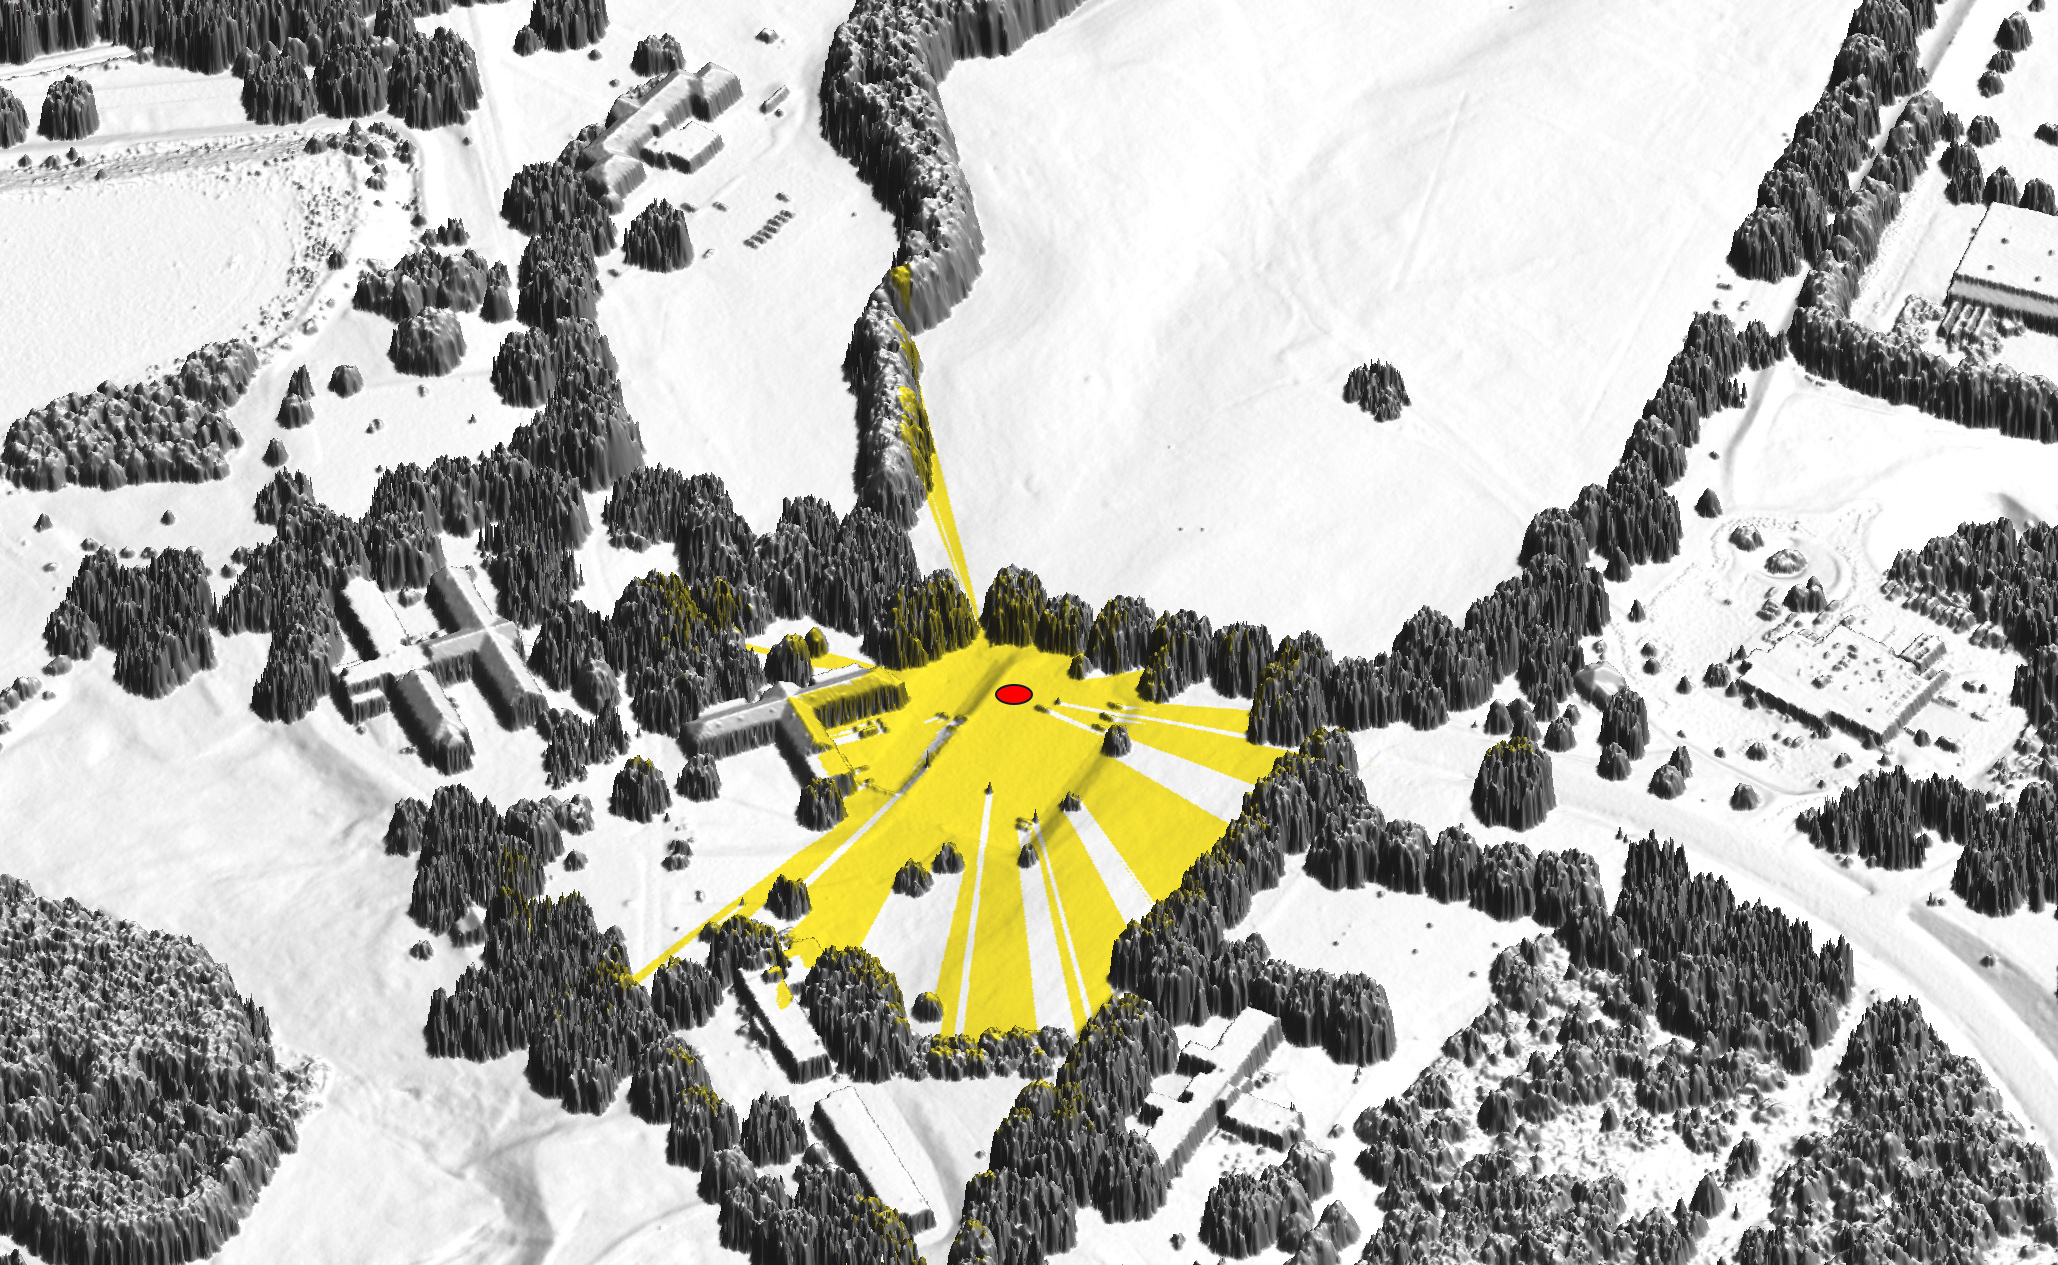
Improved viewshed extent
Payam Tabrizian PhD research project
Viewshed based on bare ground DEM, lidar DSM, and modeled trunks
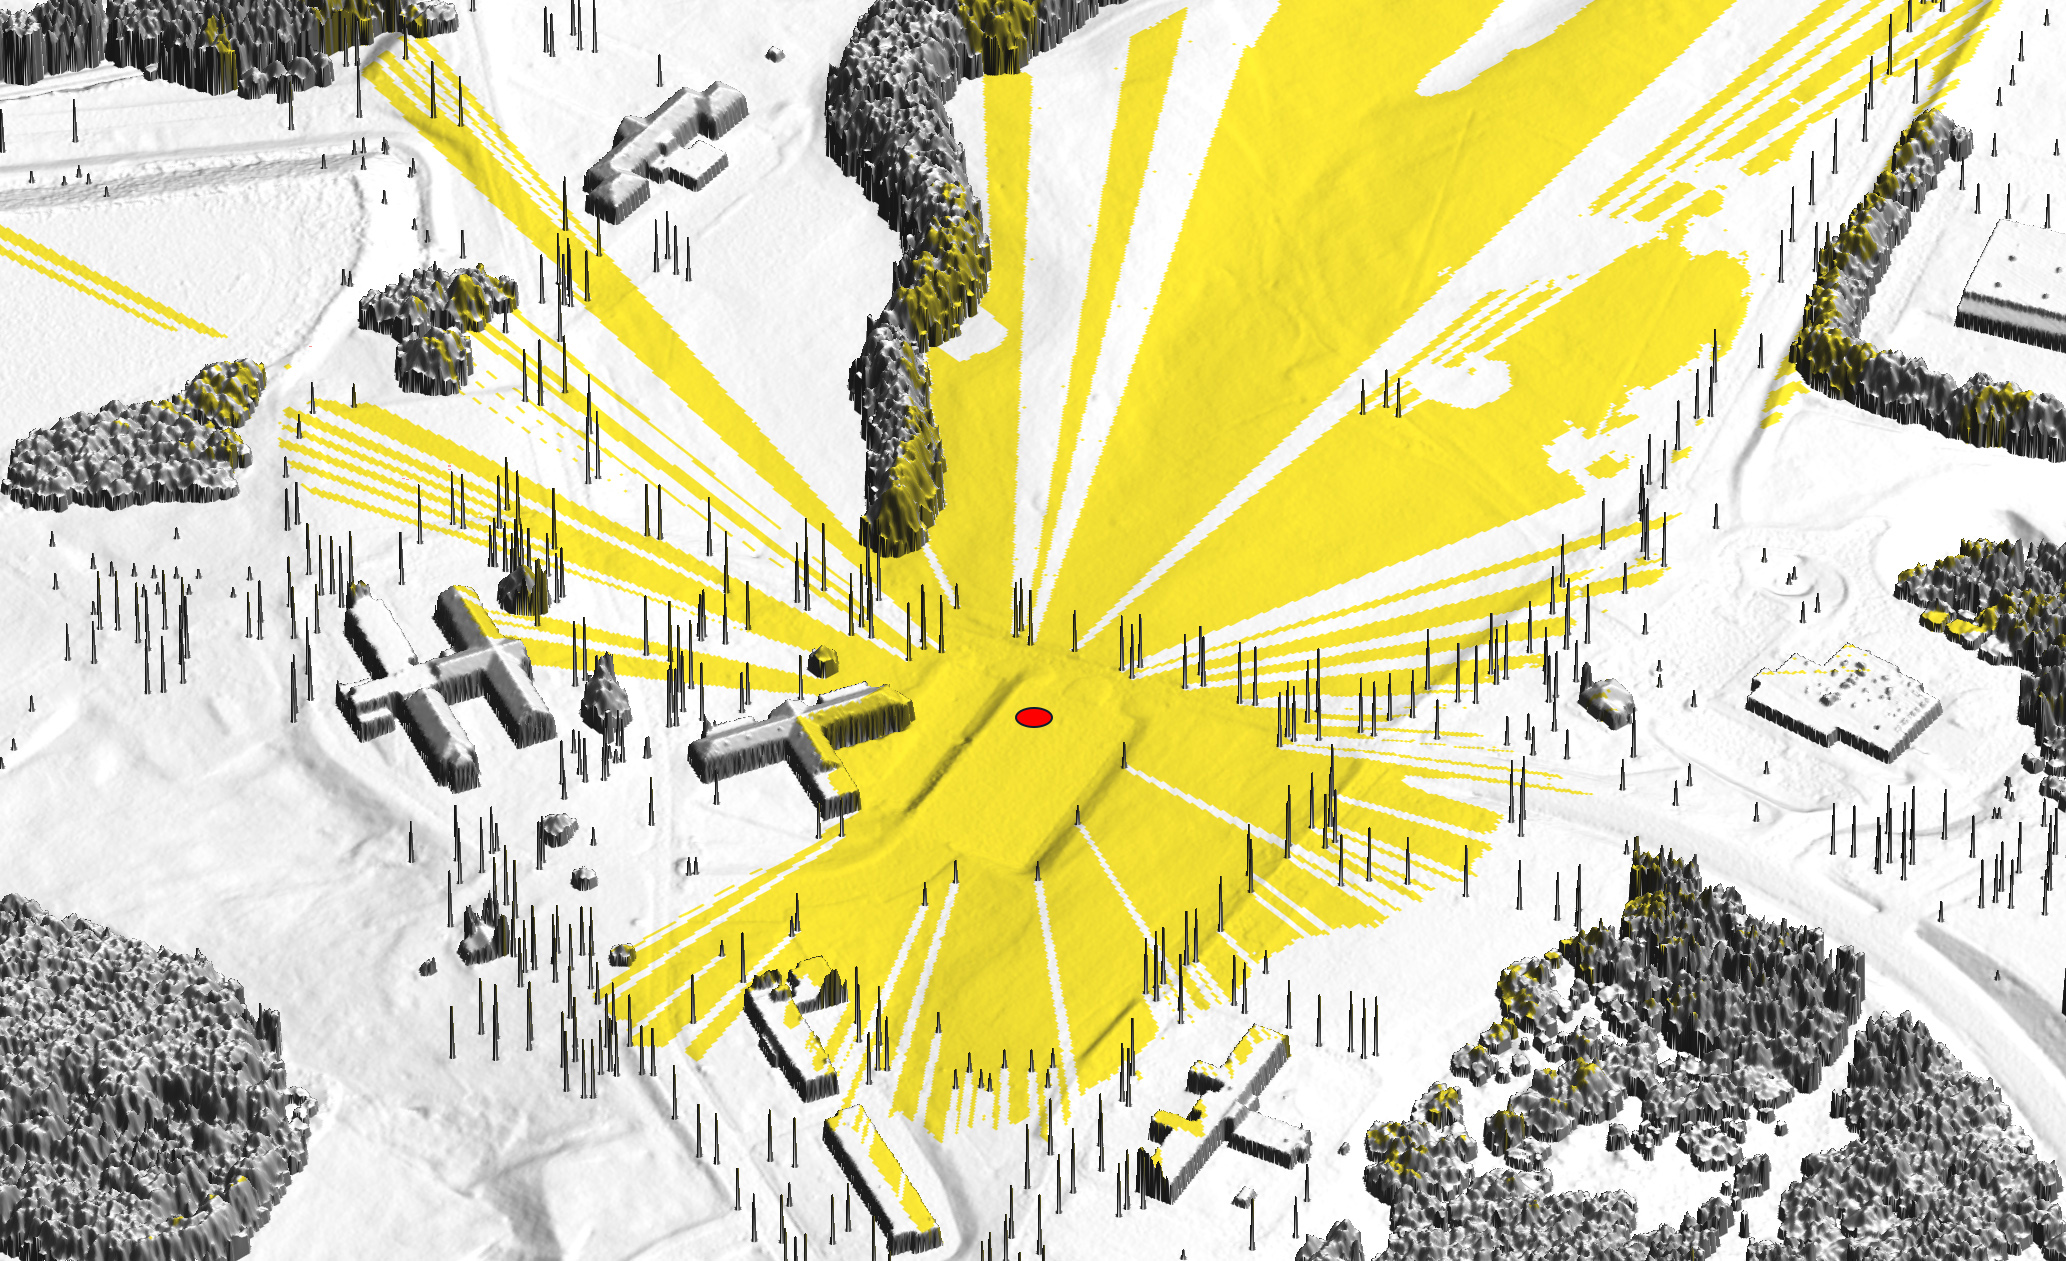
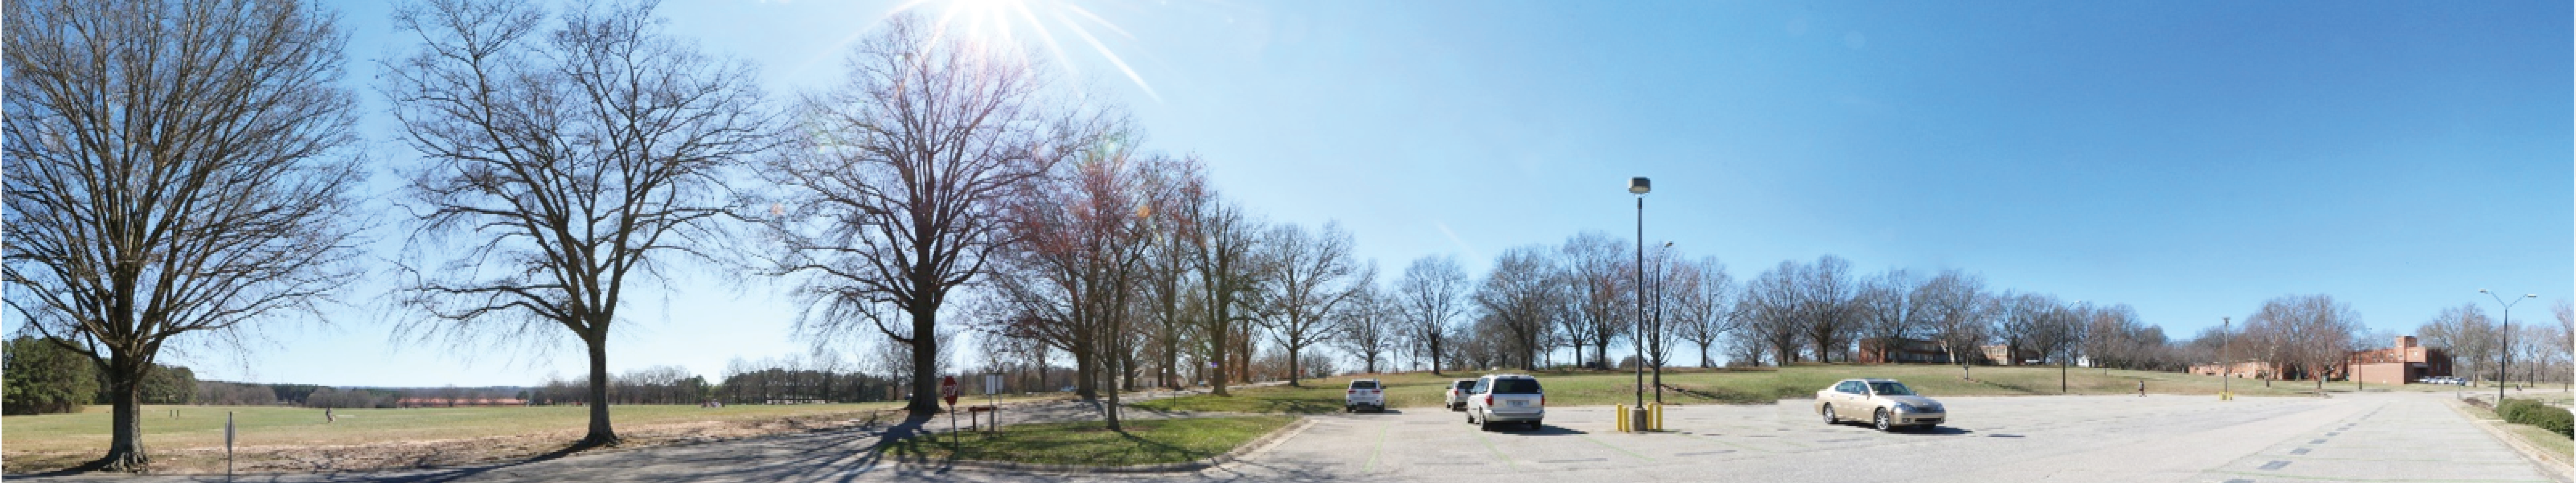
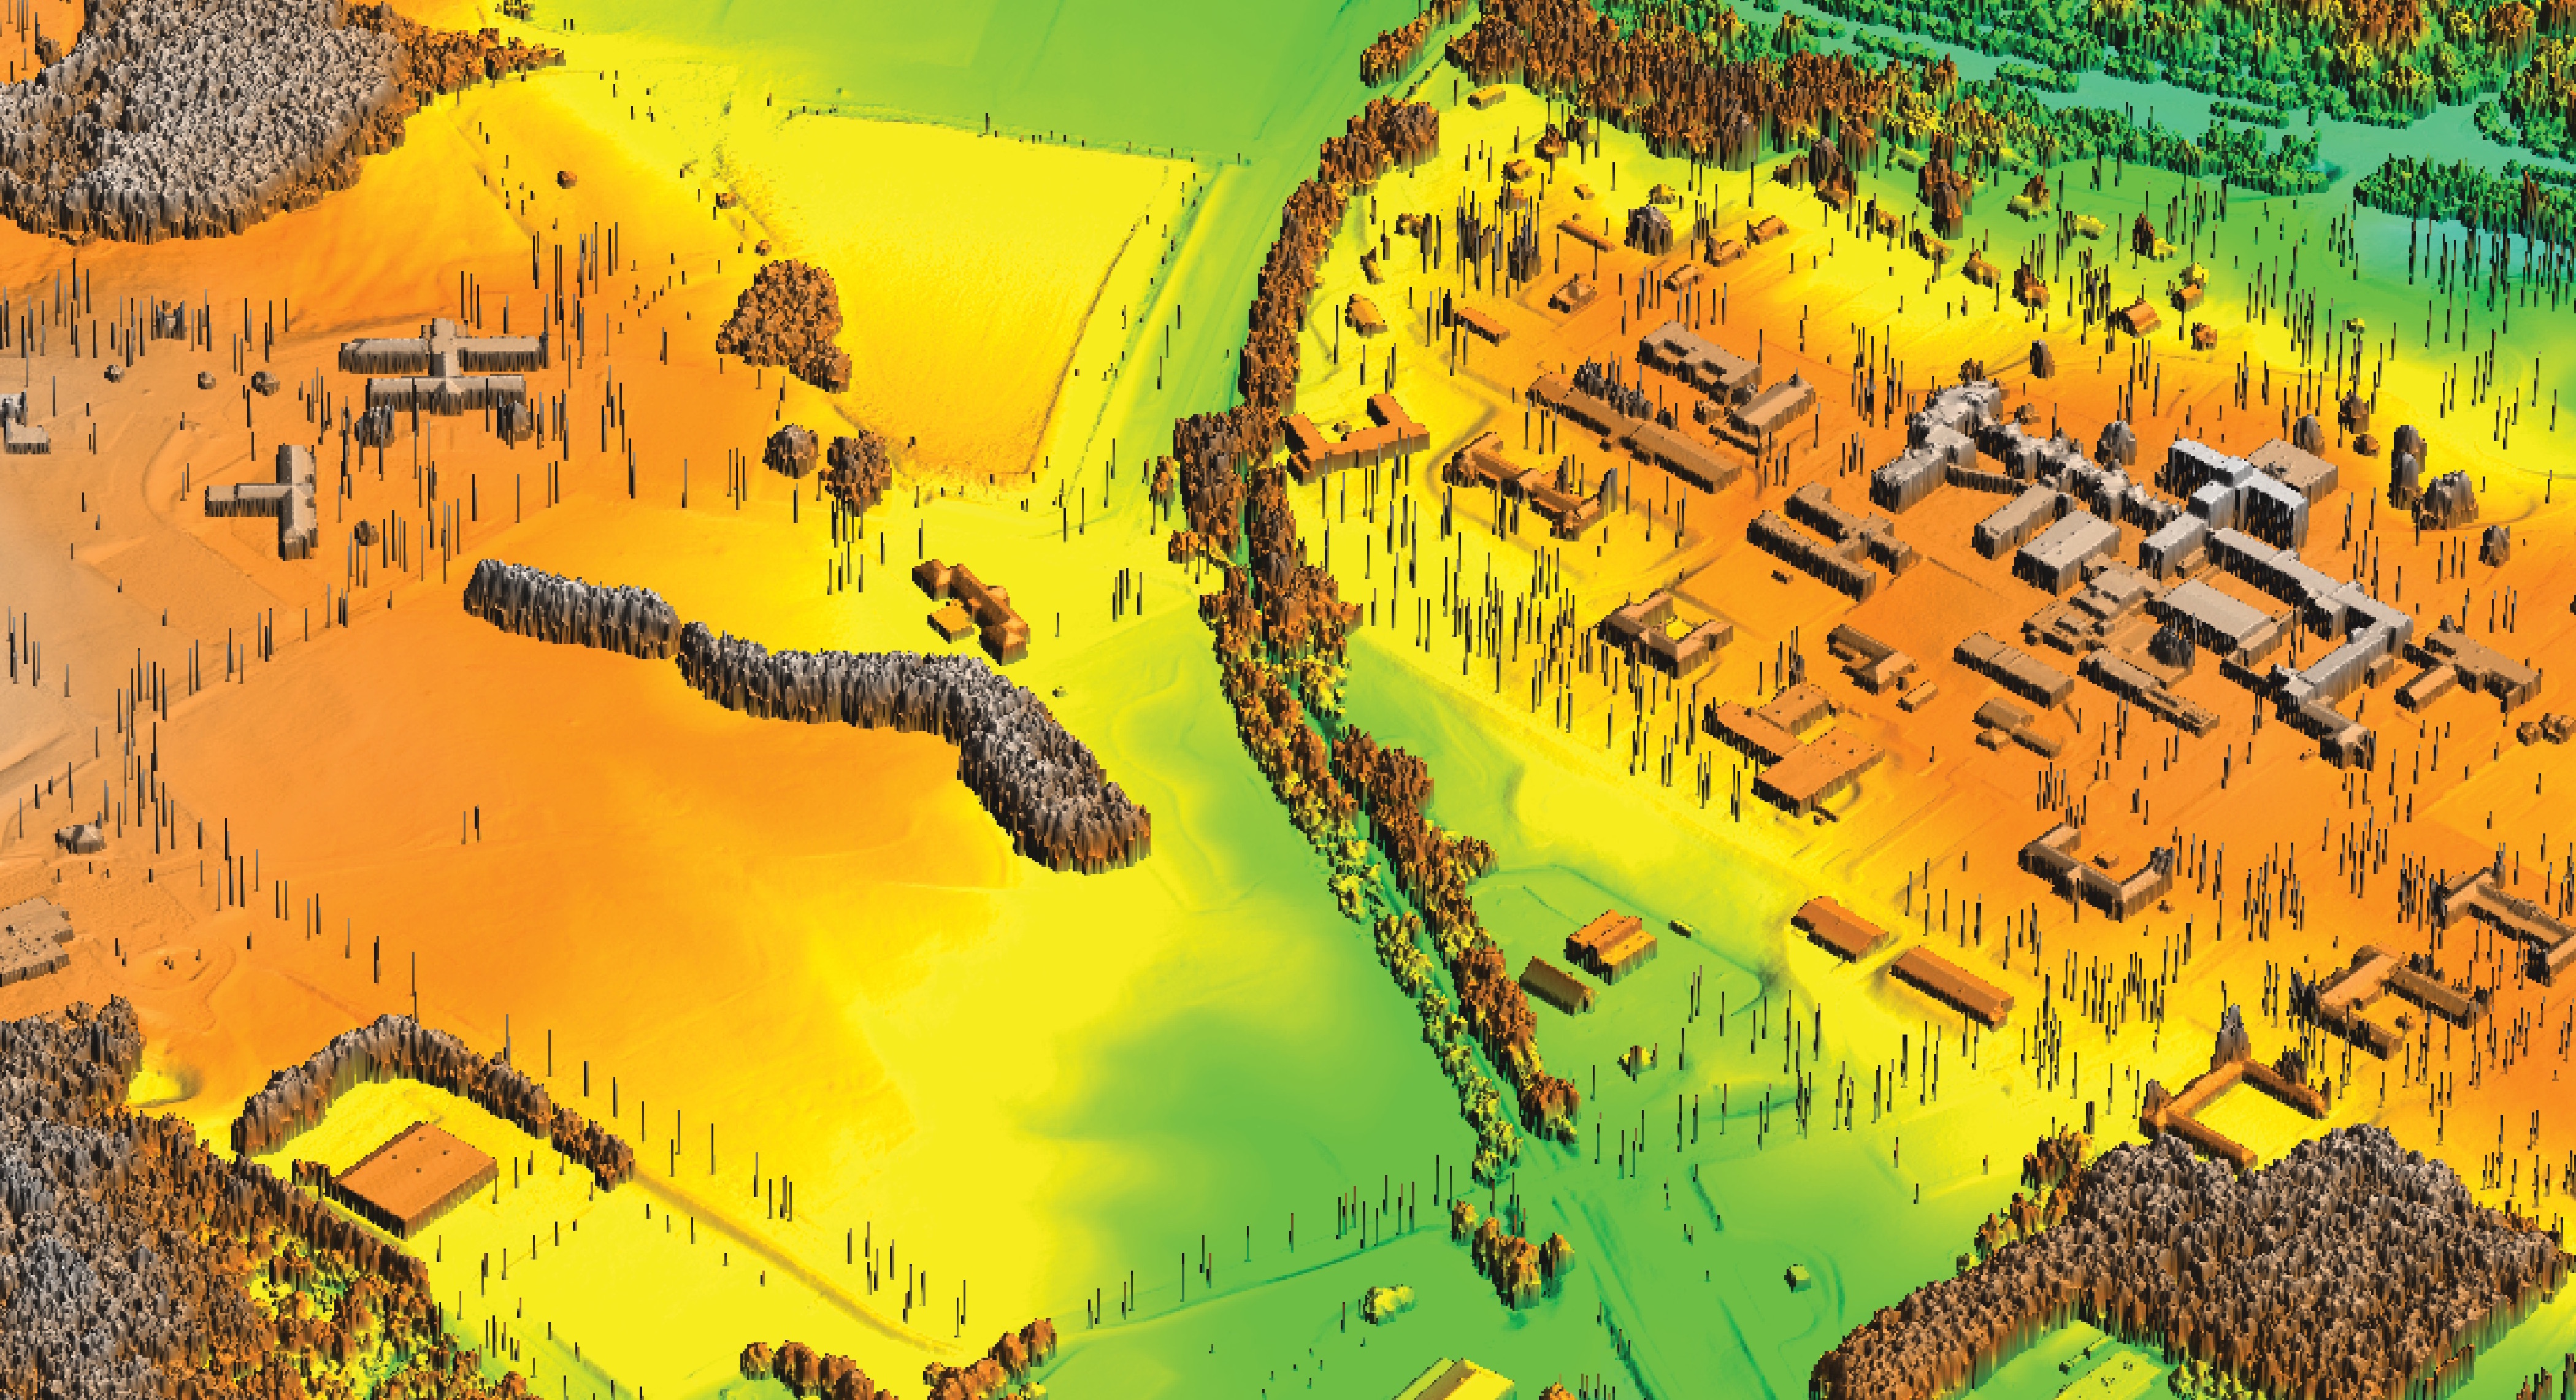
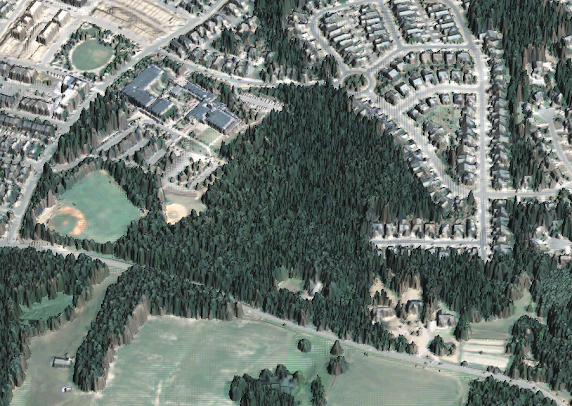
Urban topography
Solar irradiation during summer solstice at NCSU Centennial Campus, derived from lidar-based 0.5 m resolution DSM
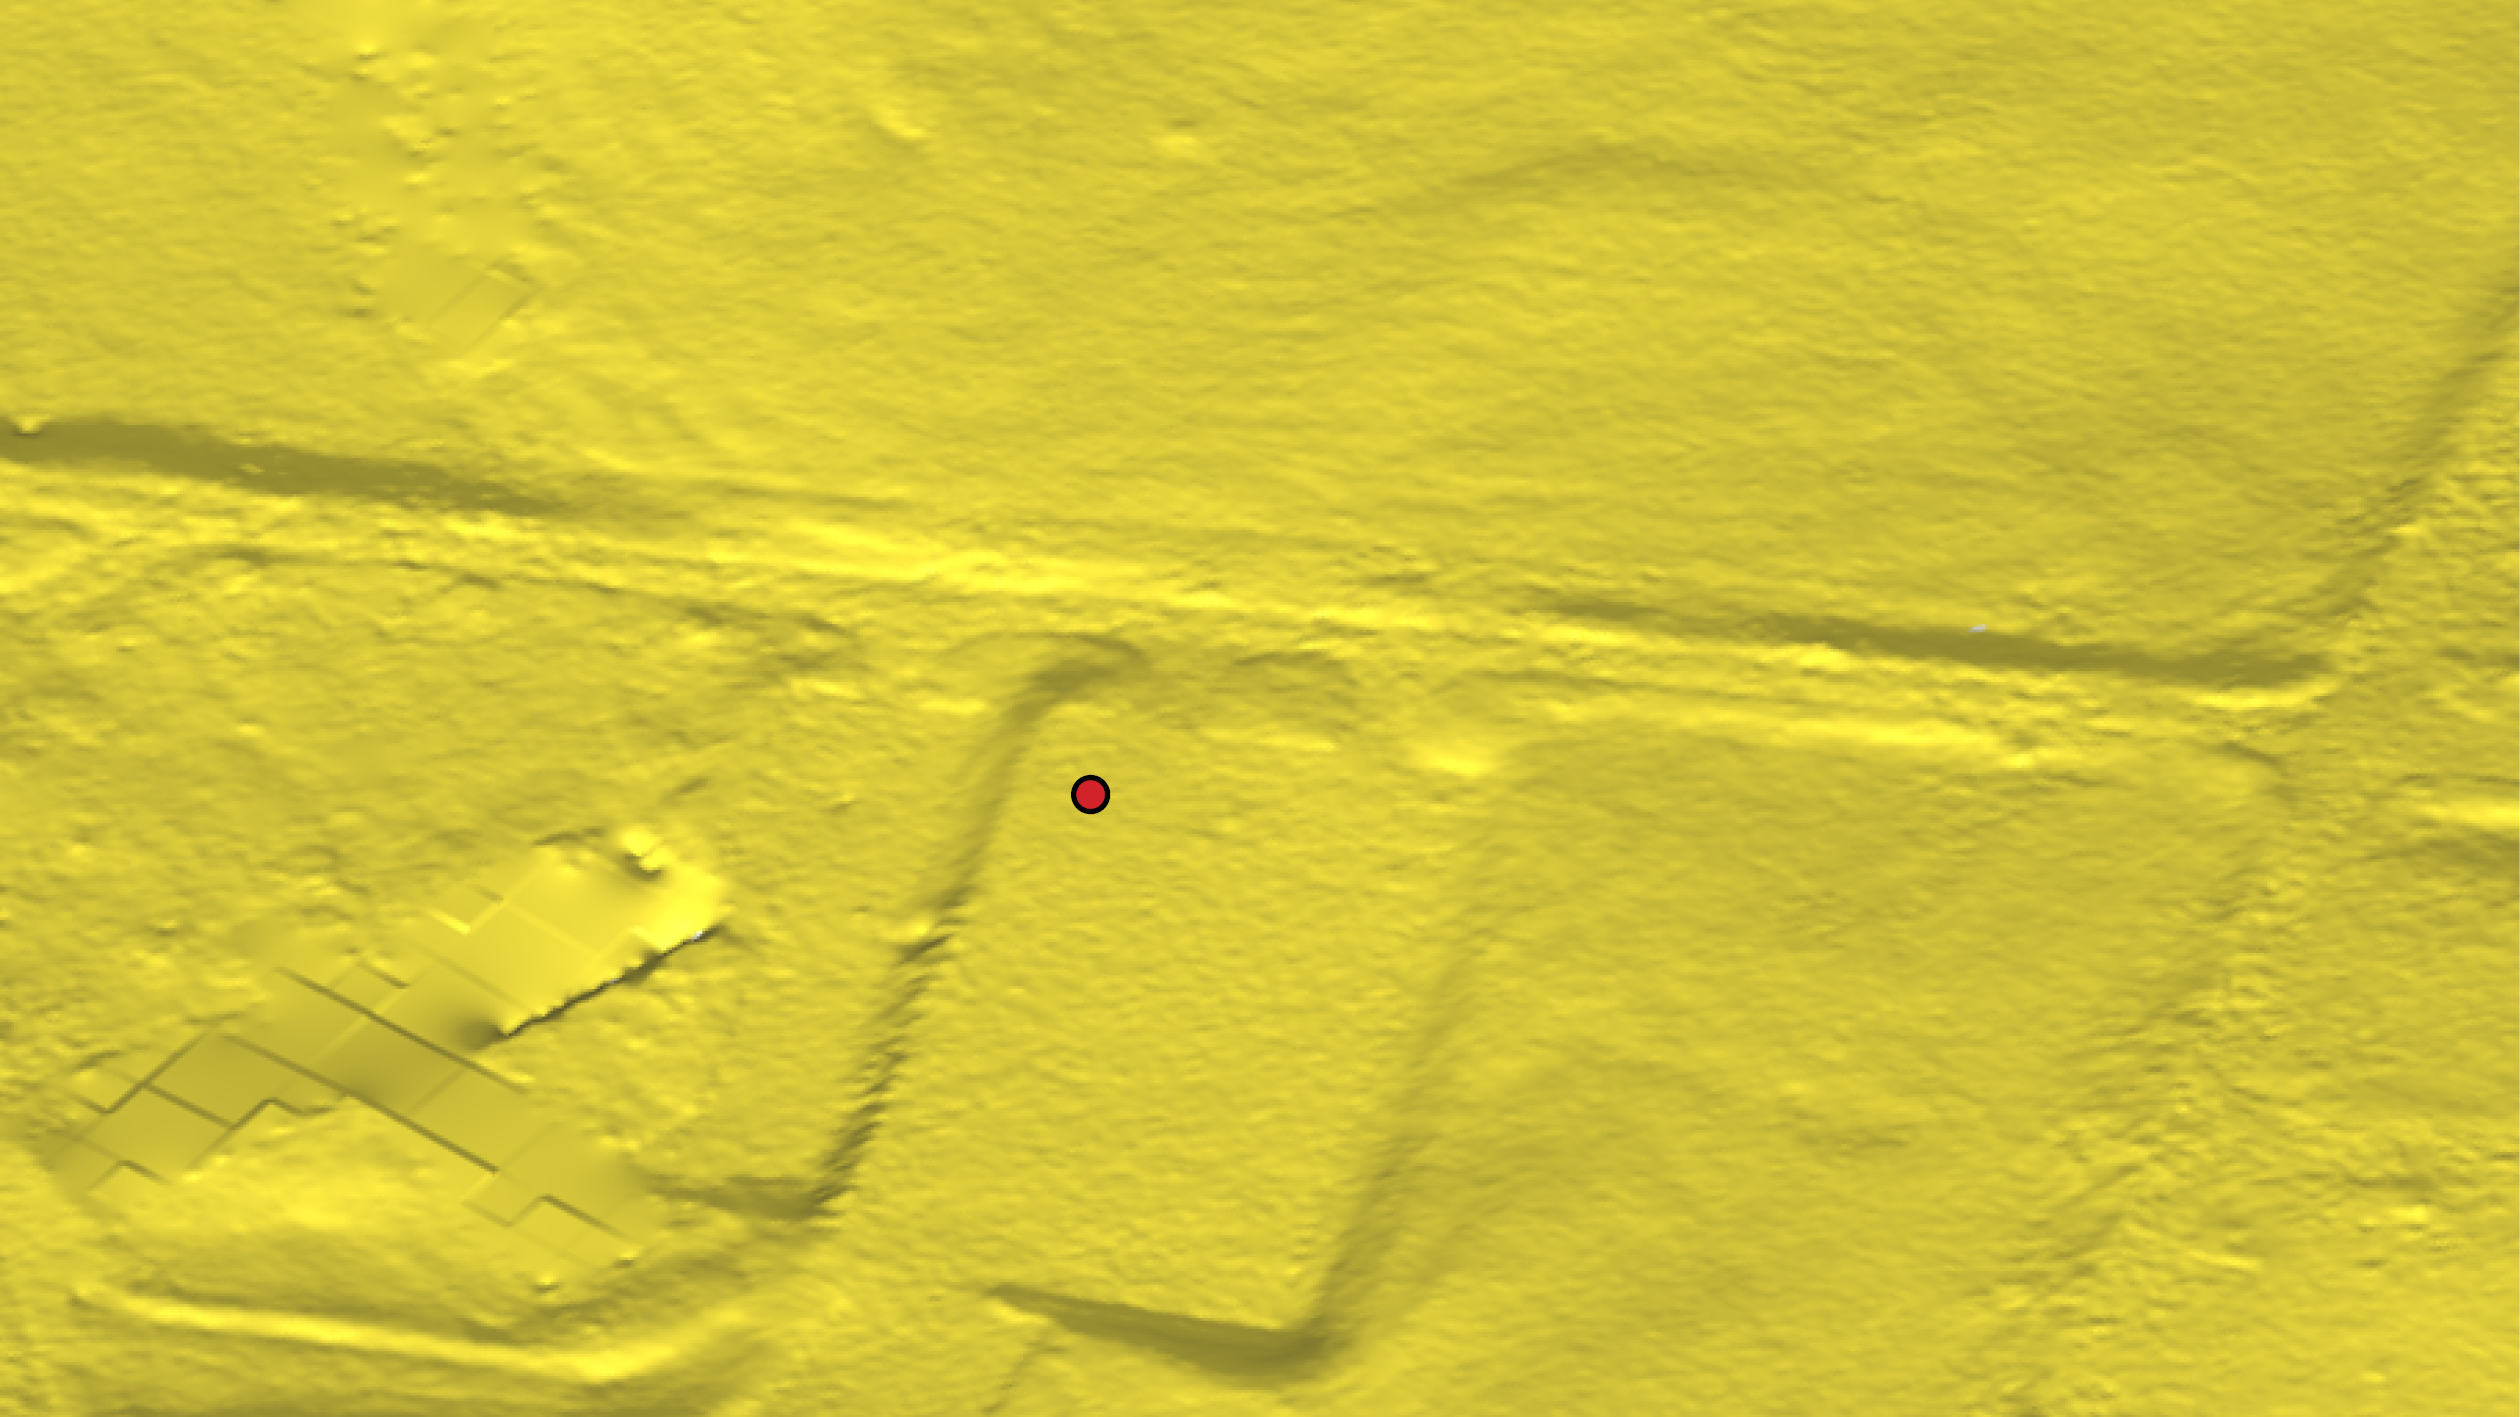
Urban topography: UAS updates
3D model of area with new buildings and removed trees
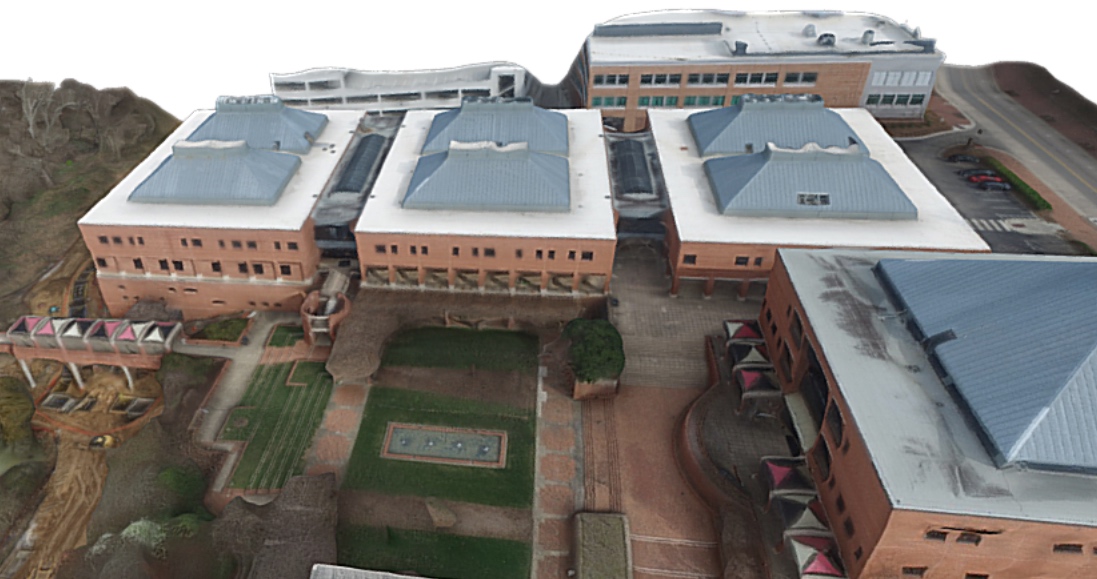
Urban topography: UAS updates
2015 lidar-based DSM updated with UAS acquired data
Urban topography: UAS updates
2015 lidar-based DSM in rapidly urbanizing area
Urban topography: UAS updates
2015 lidar updated with 2018 UAS data: forested are replaced by a new school
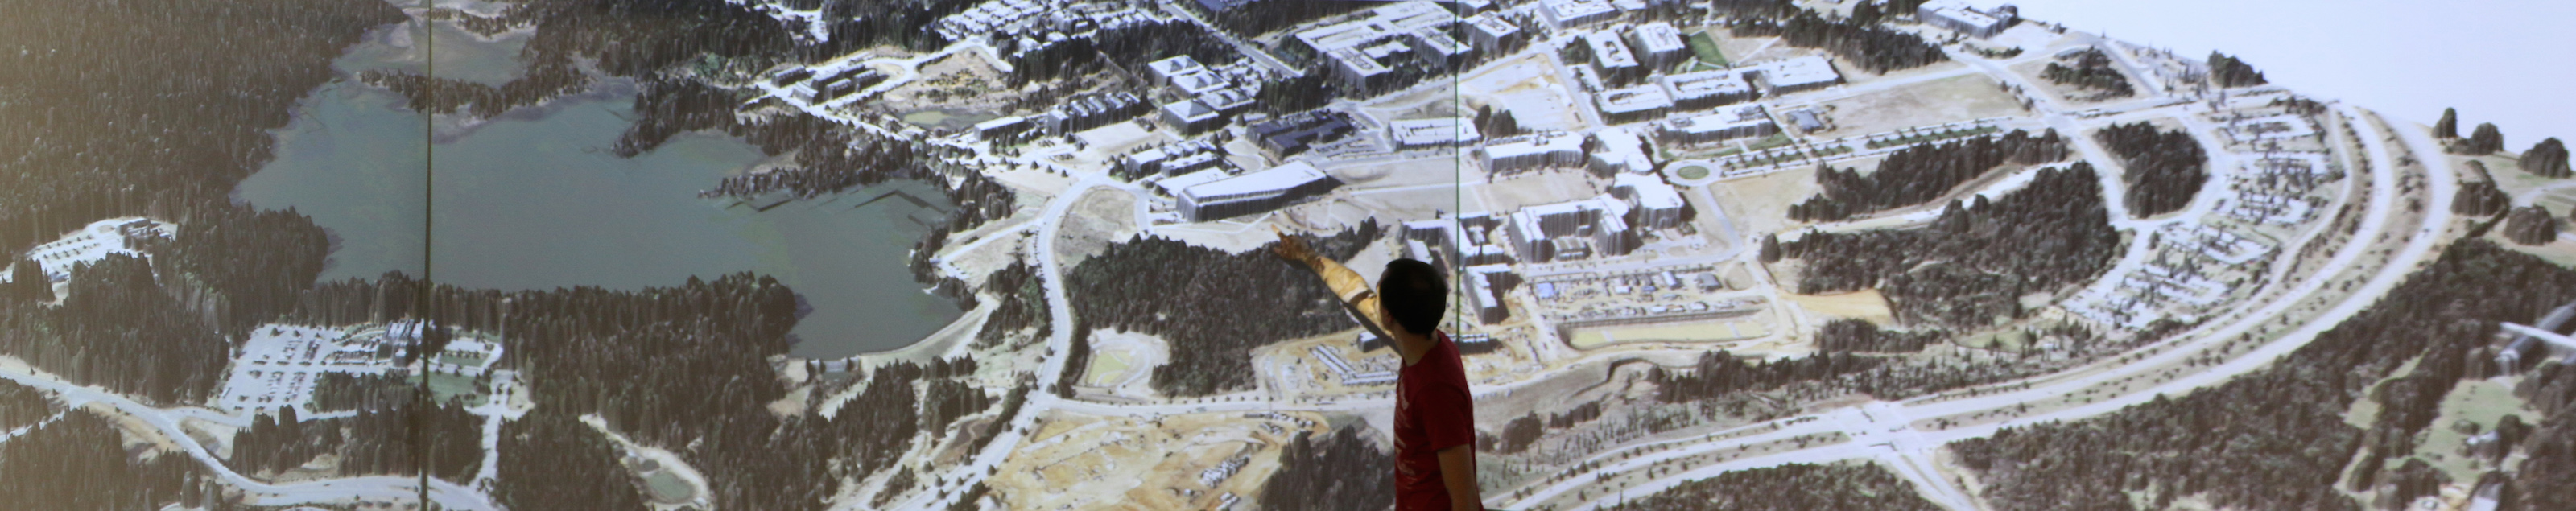
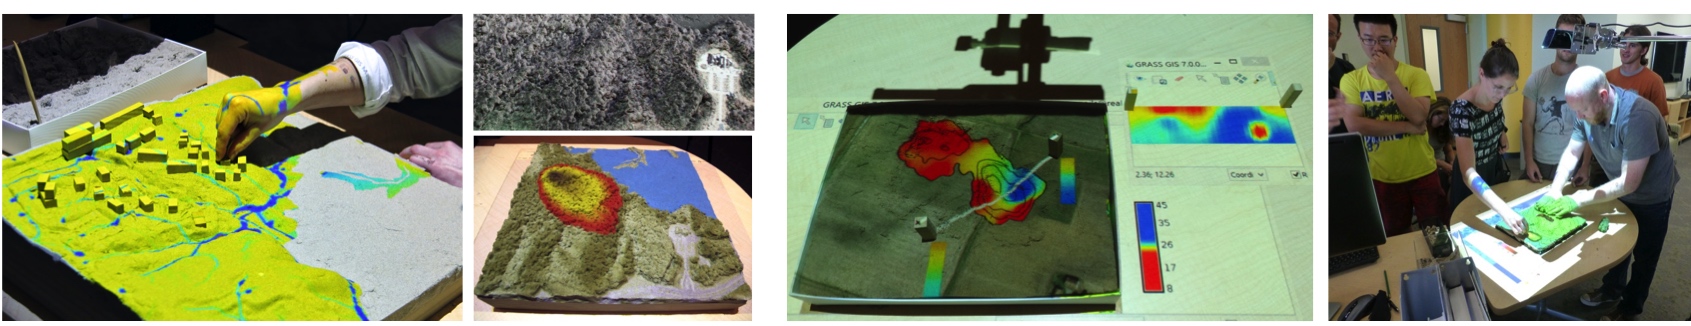
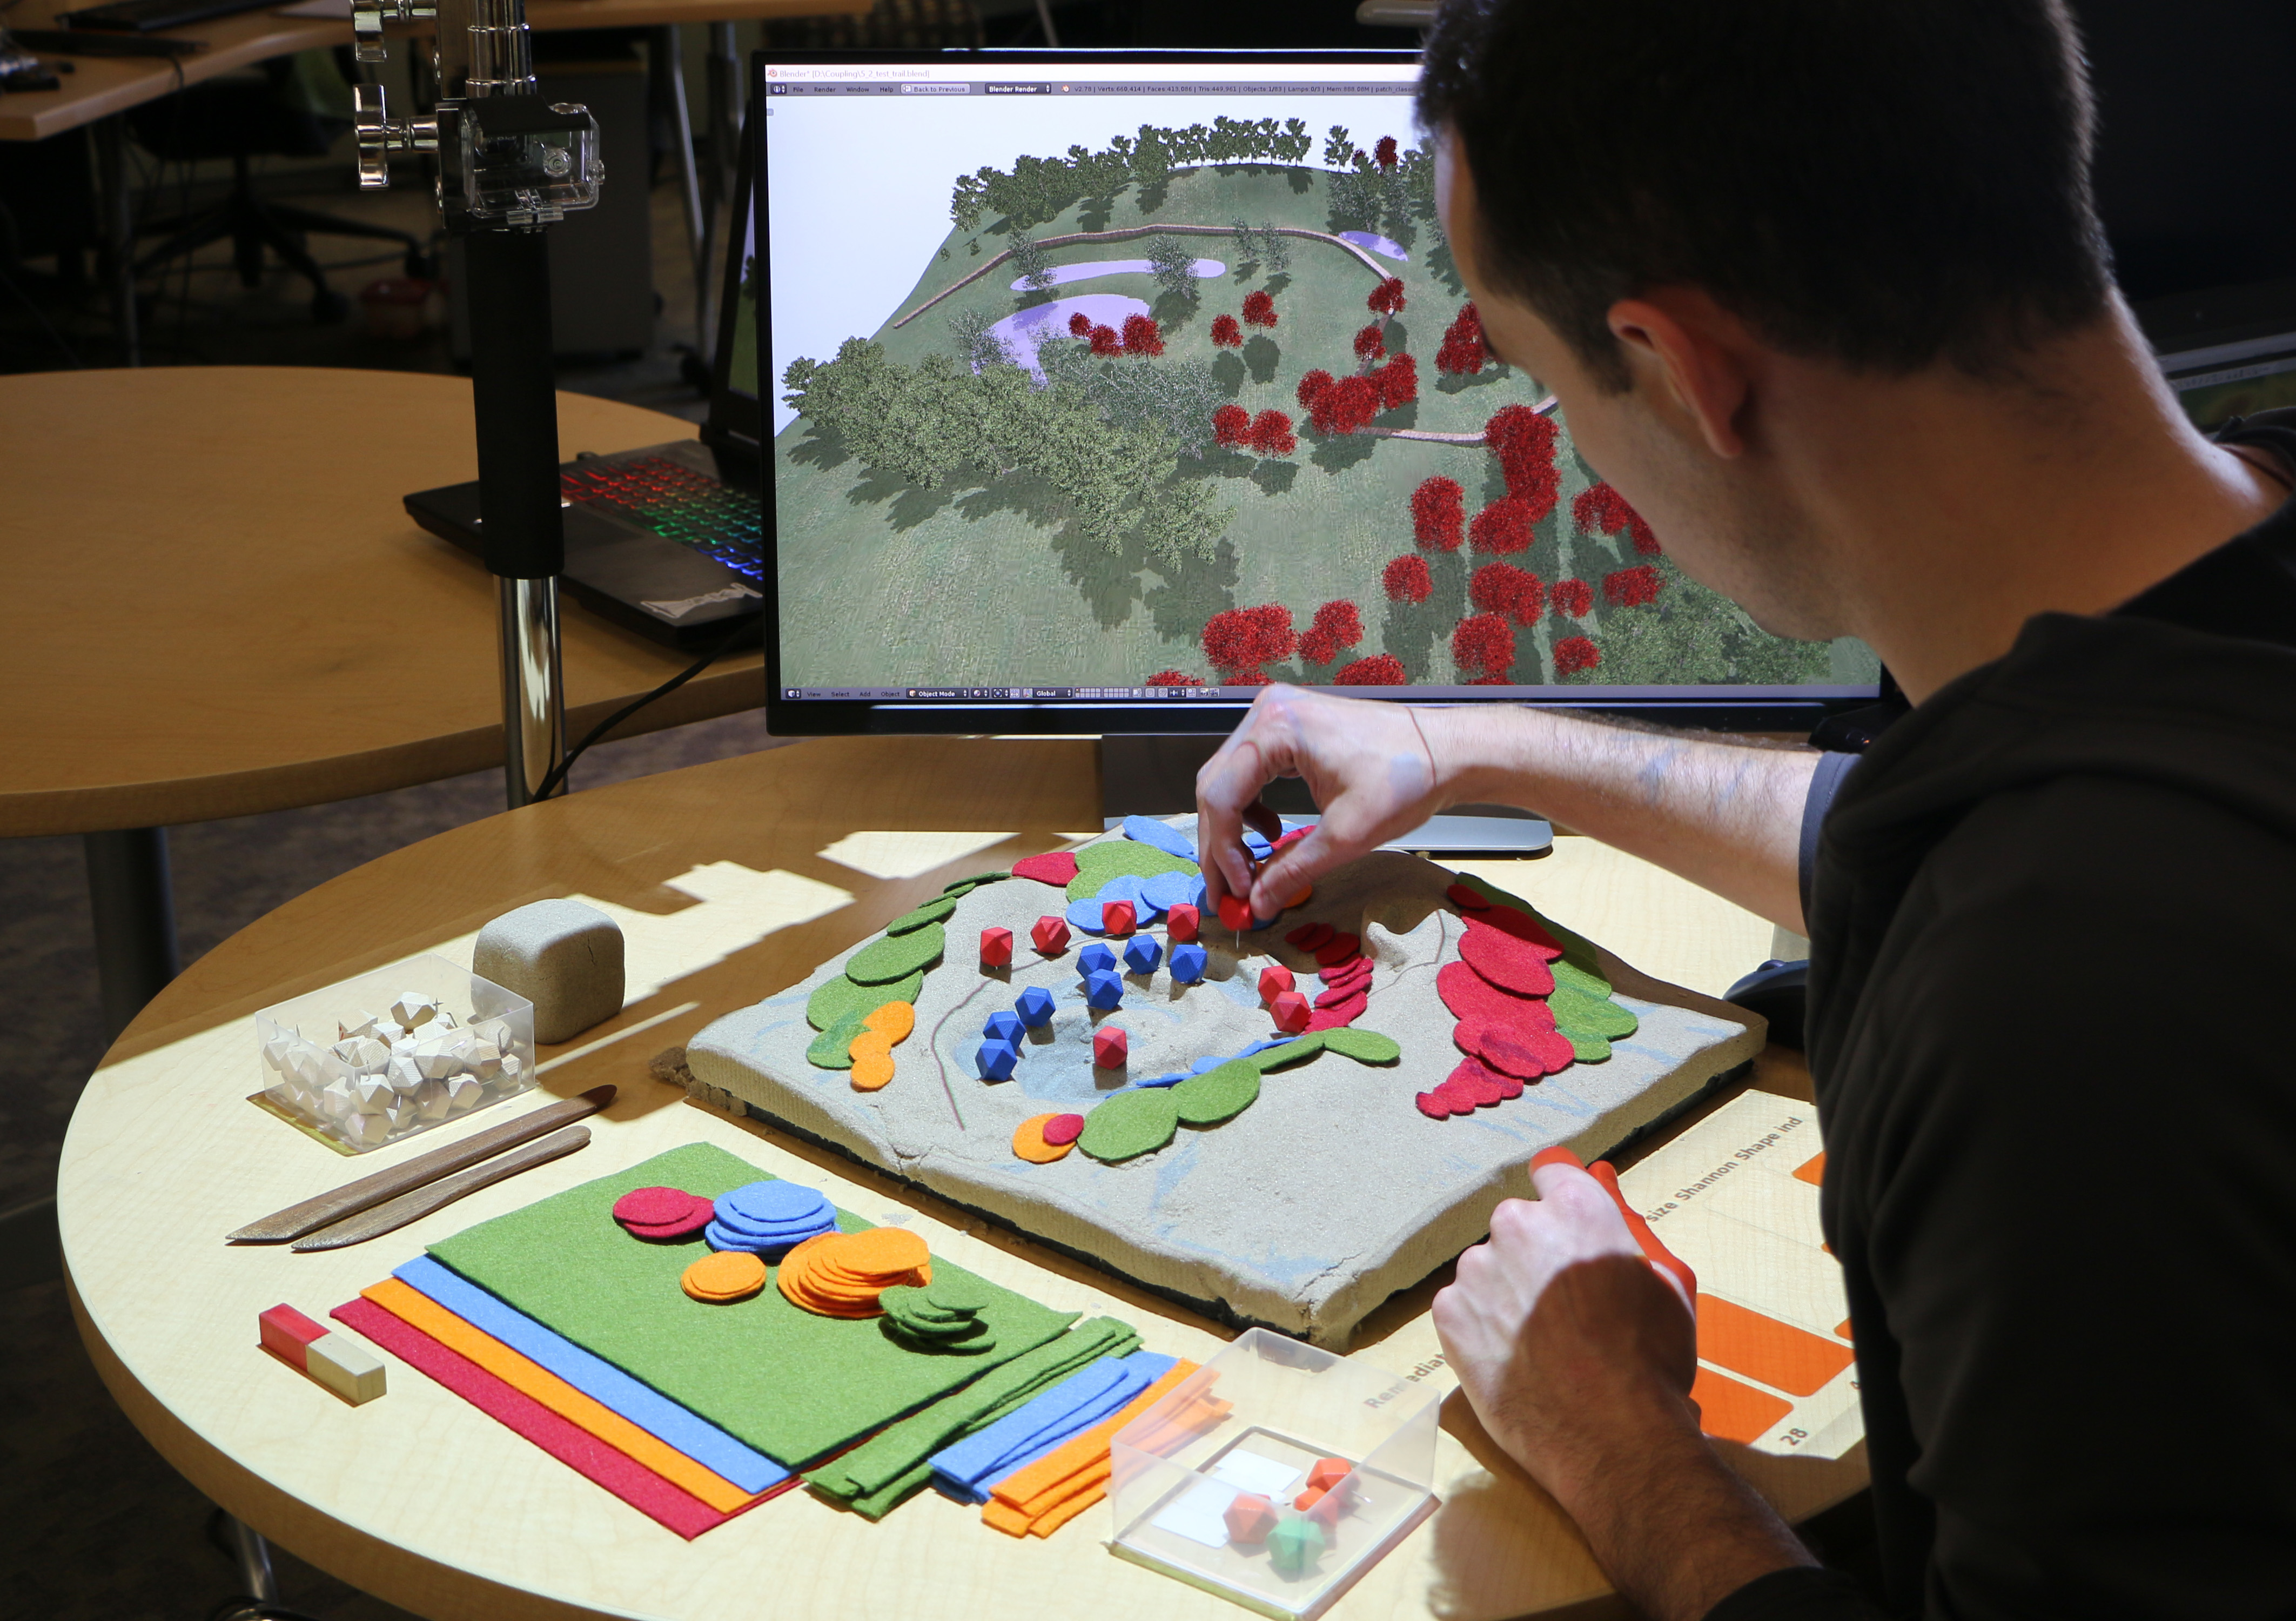
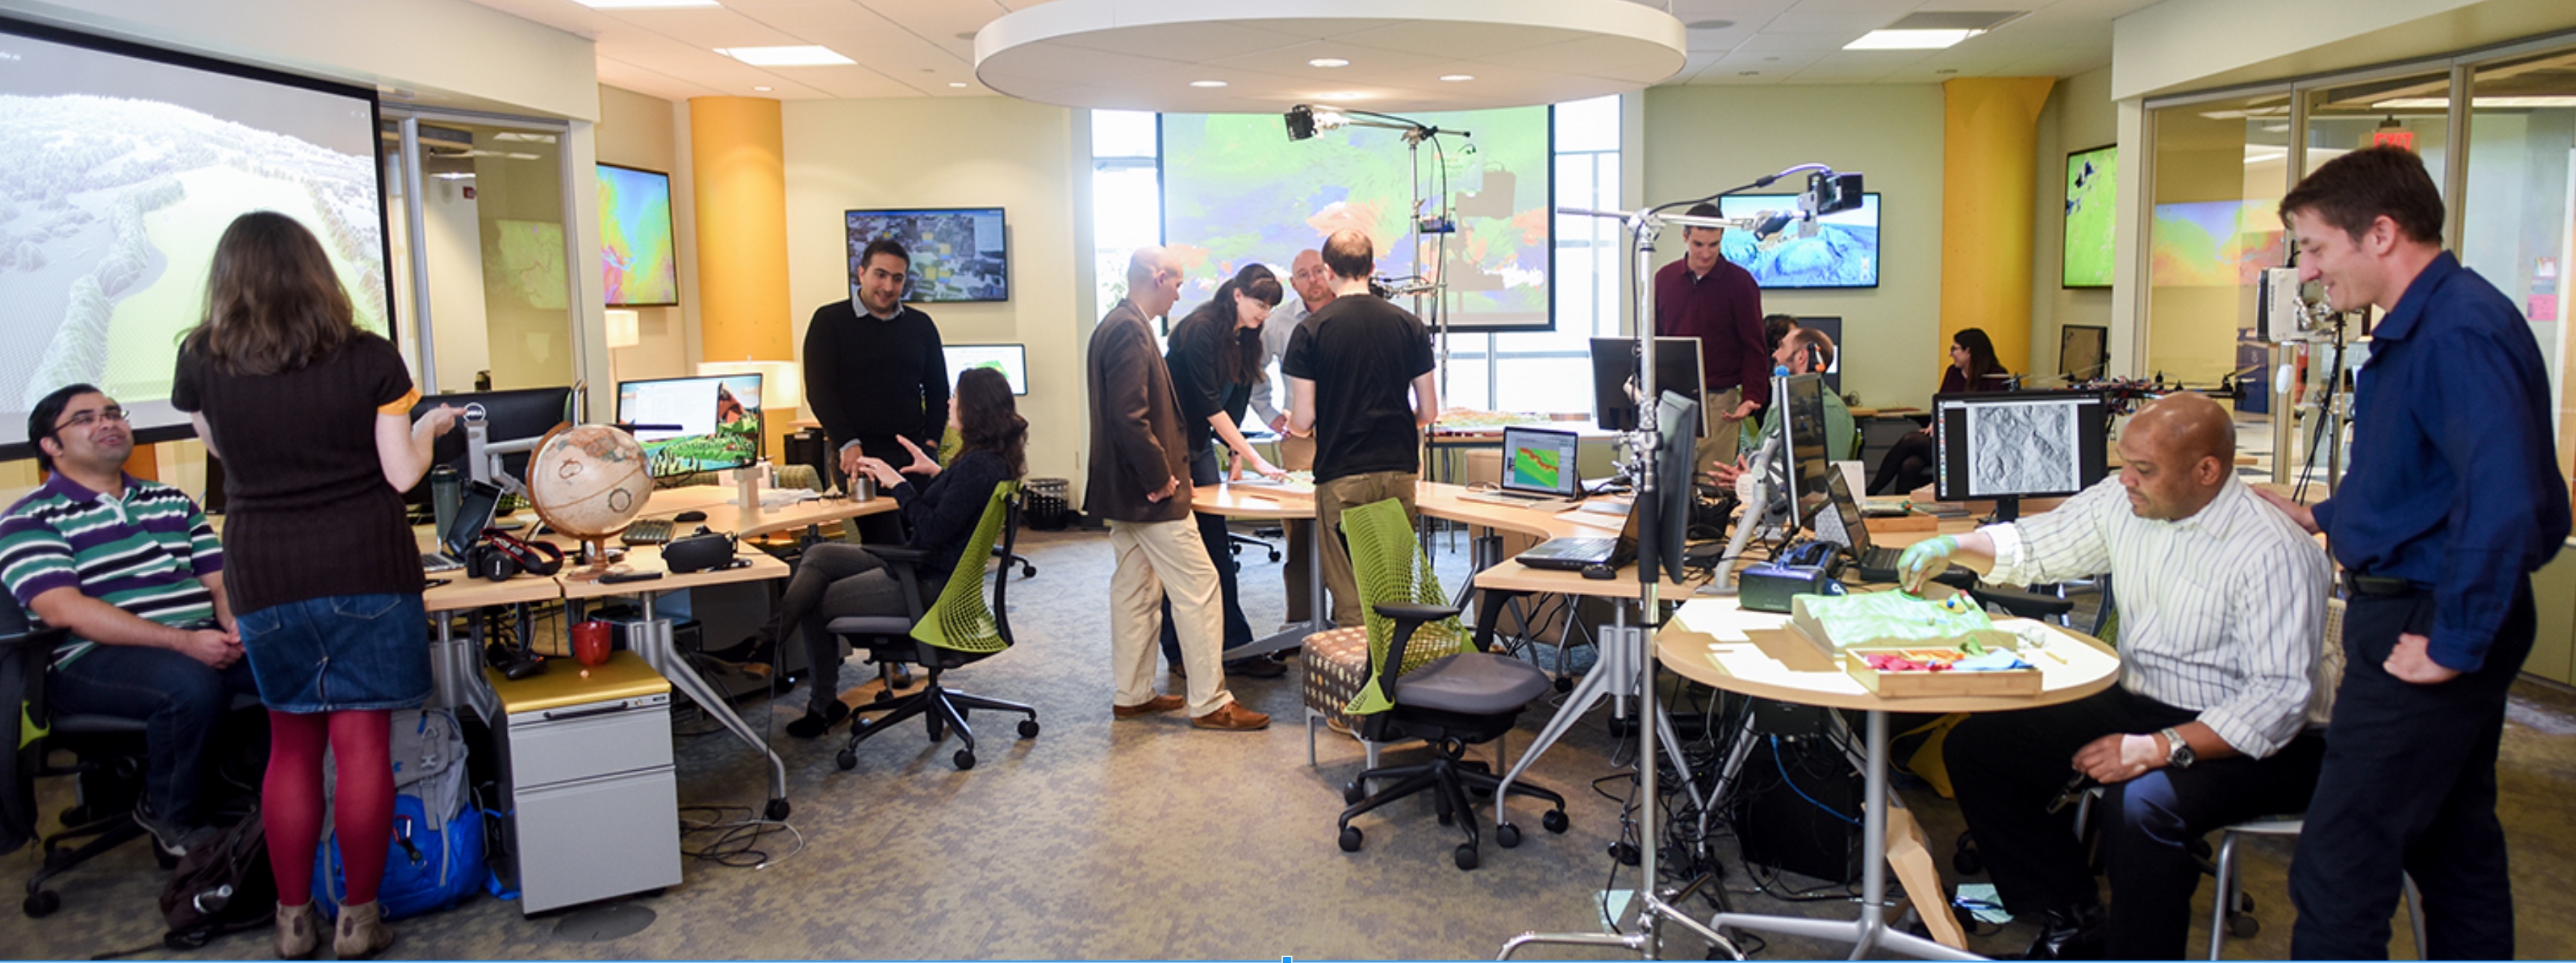
Tangible interface for surface analysis and process modeling
Tangible Landscape
Bringing people together around GIS: Tangible user interface for GRASS GIS
Designed to make working with geospatial data and simulations engaging, and fun
Petrasova, A. et al. (2018). Tangible Modeling with Open Source GIS. Second edition. Springer International Publishing. https://doi.org/10.1007/978-3-319-89303-7
How does it work?
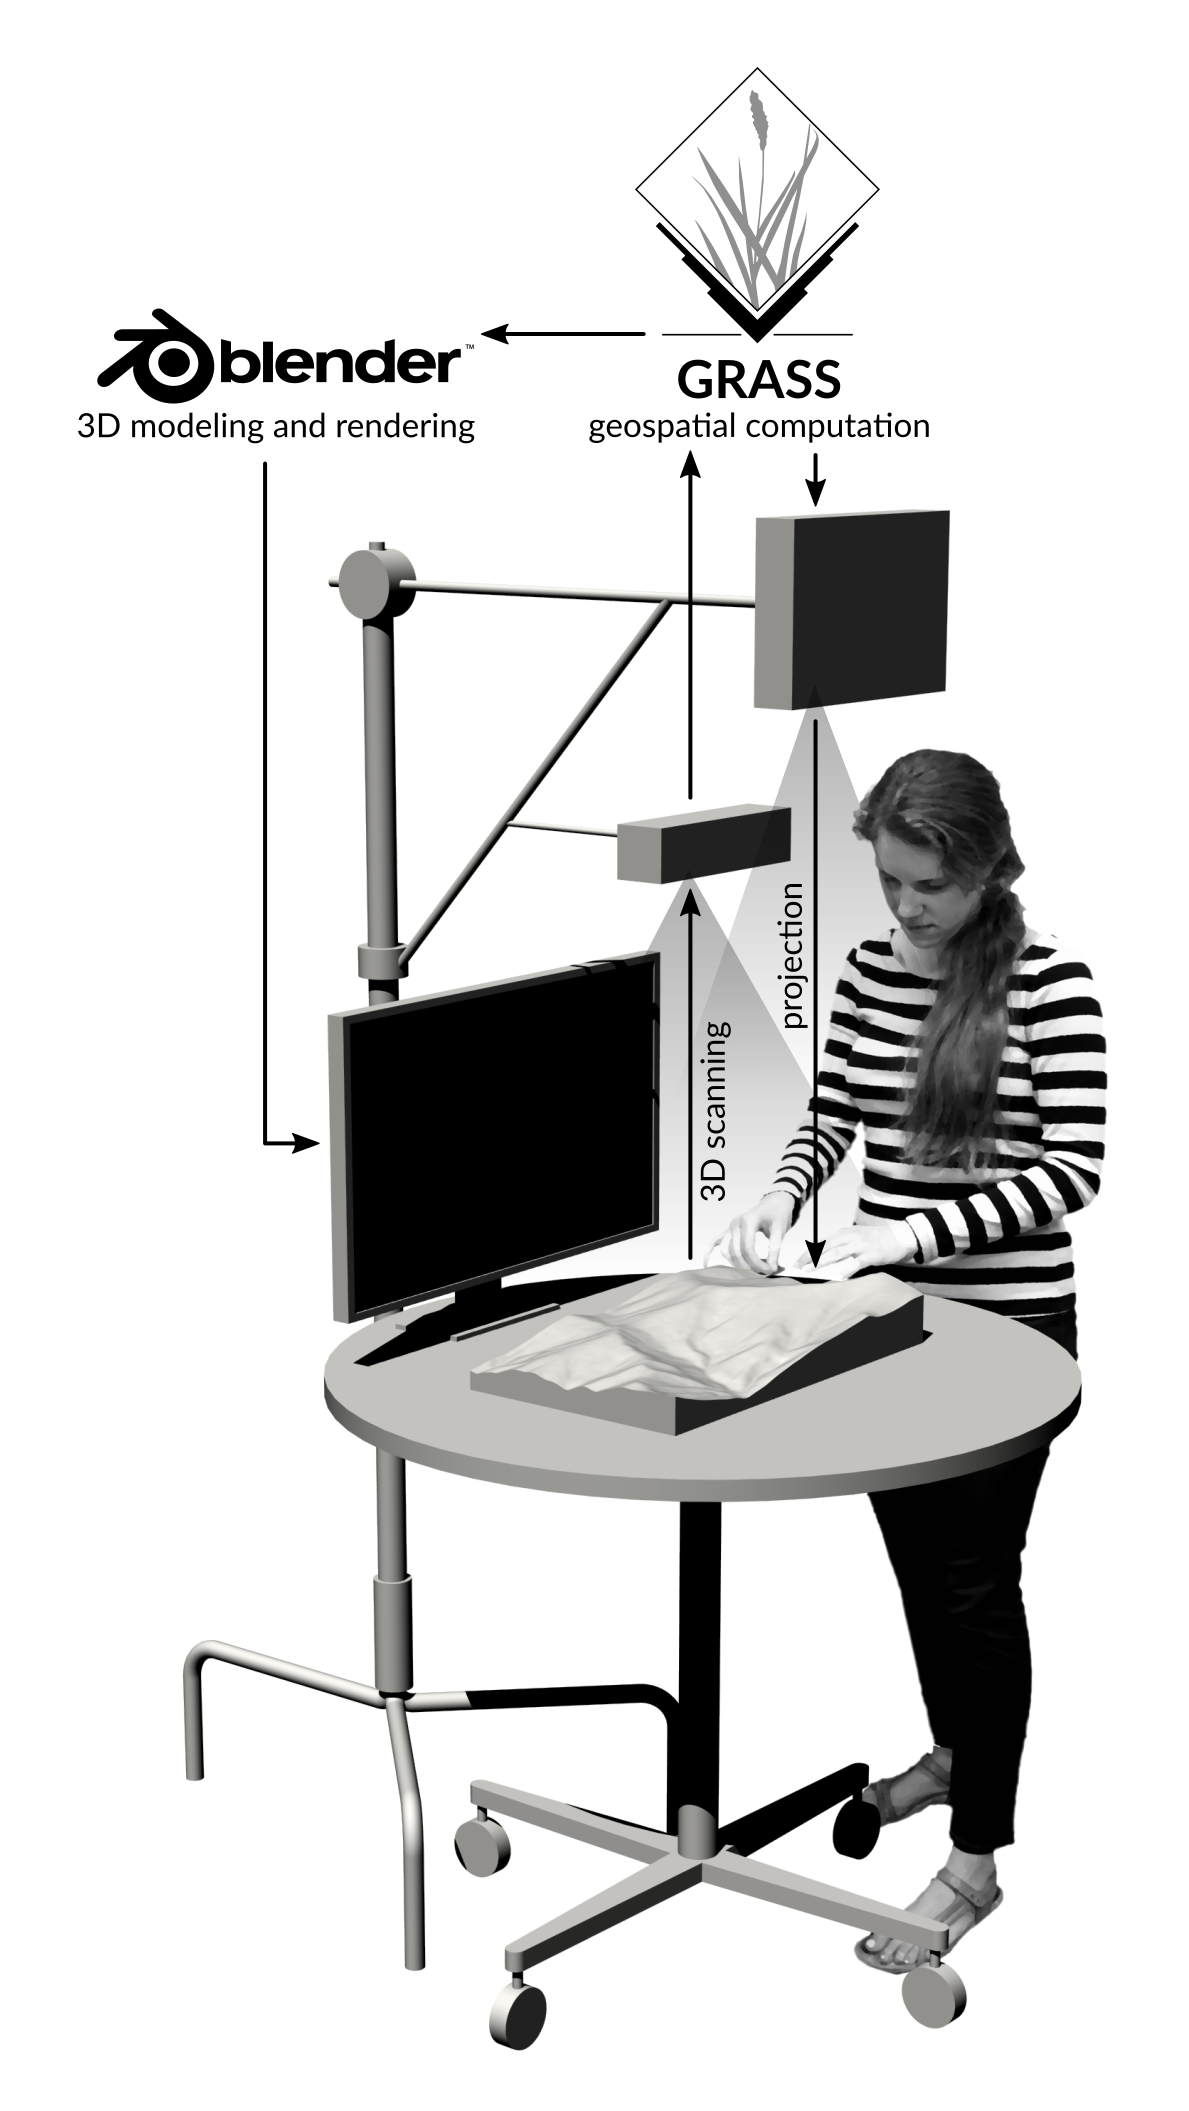
Tangible Landscape couples a digital and a physical model through a continuous cycle of 3D scanning, geospatial modeling, and projection
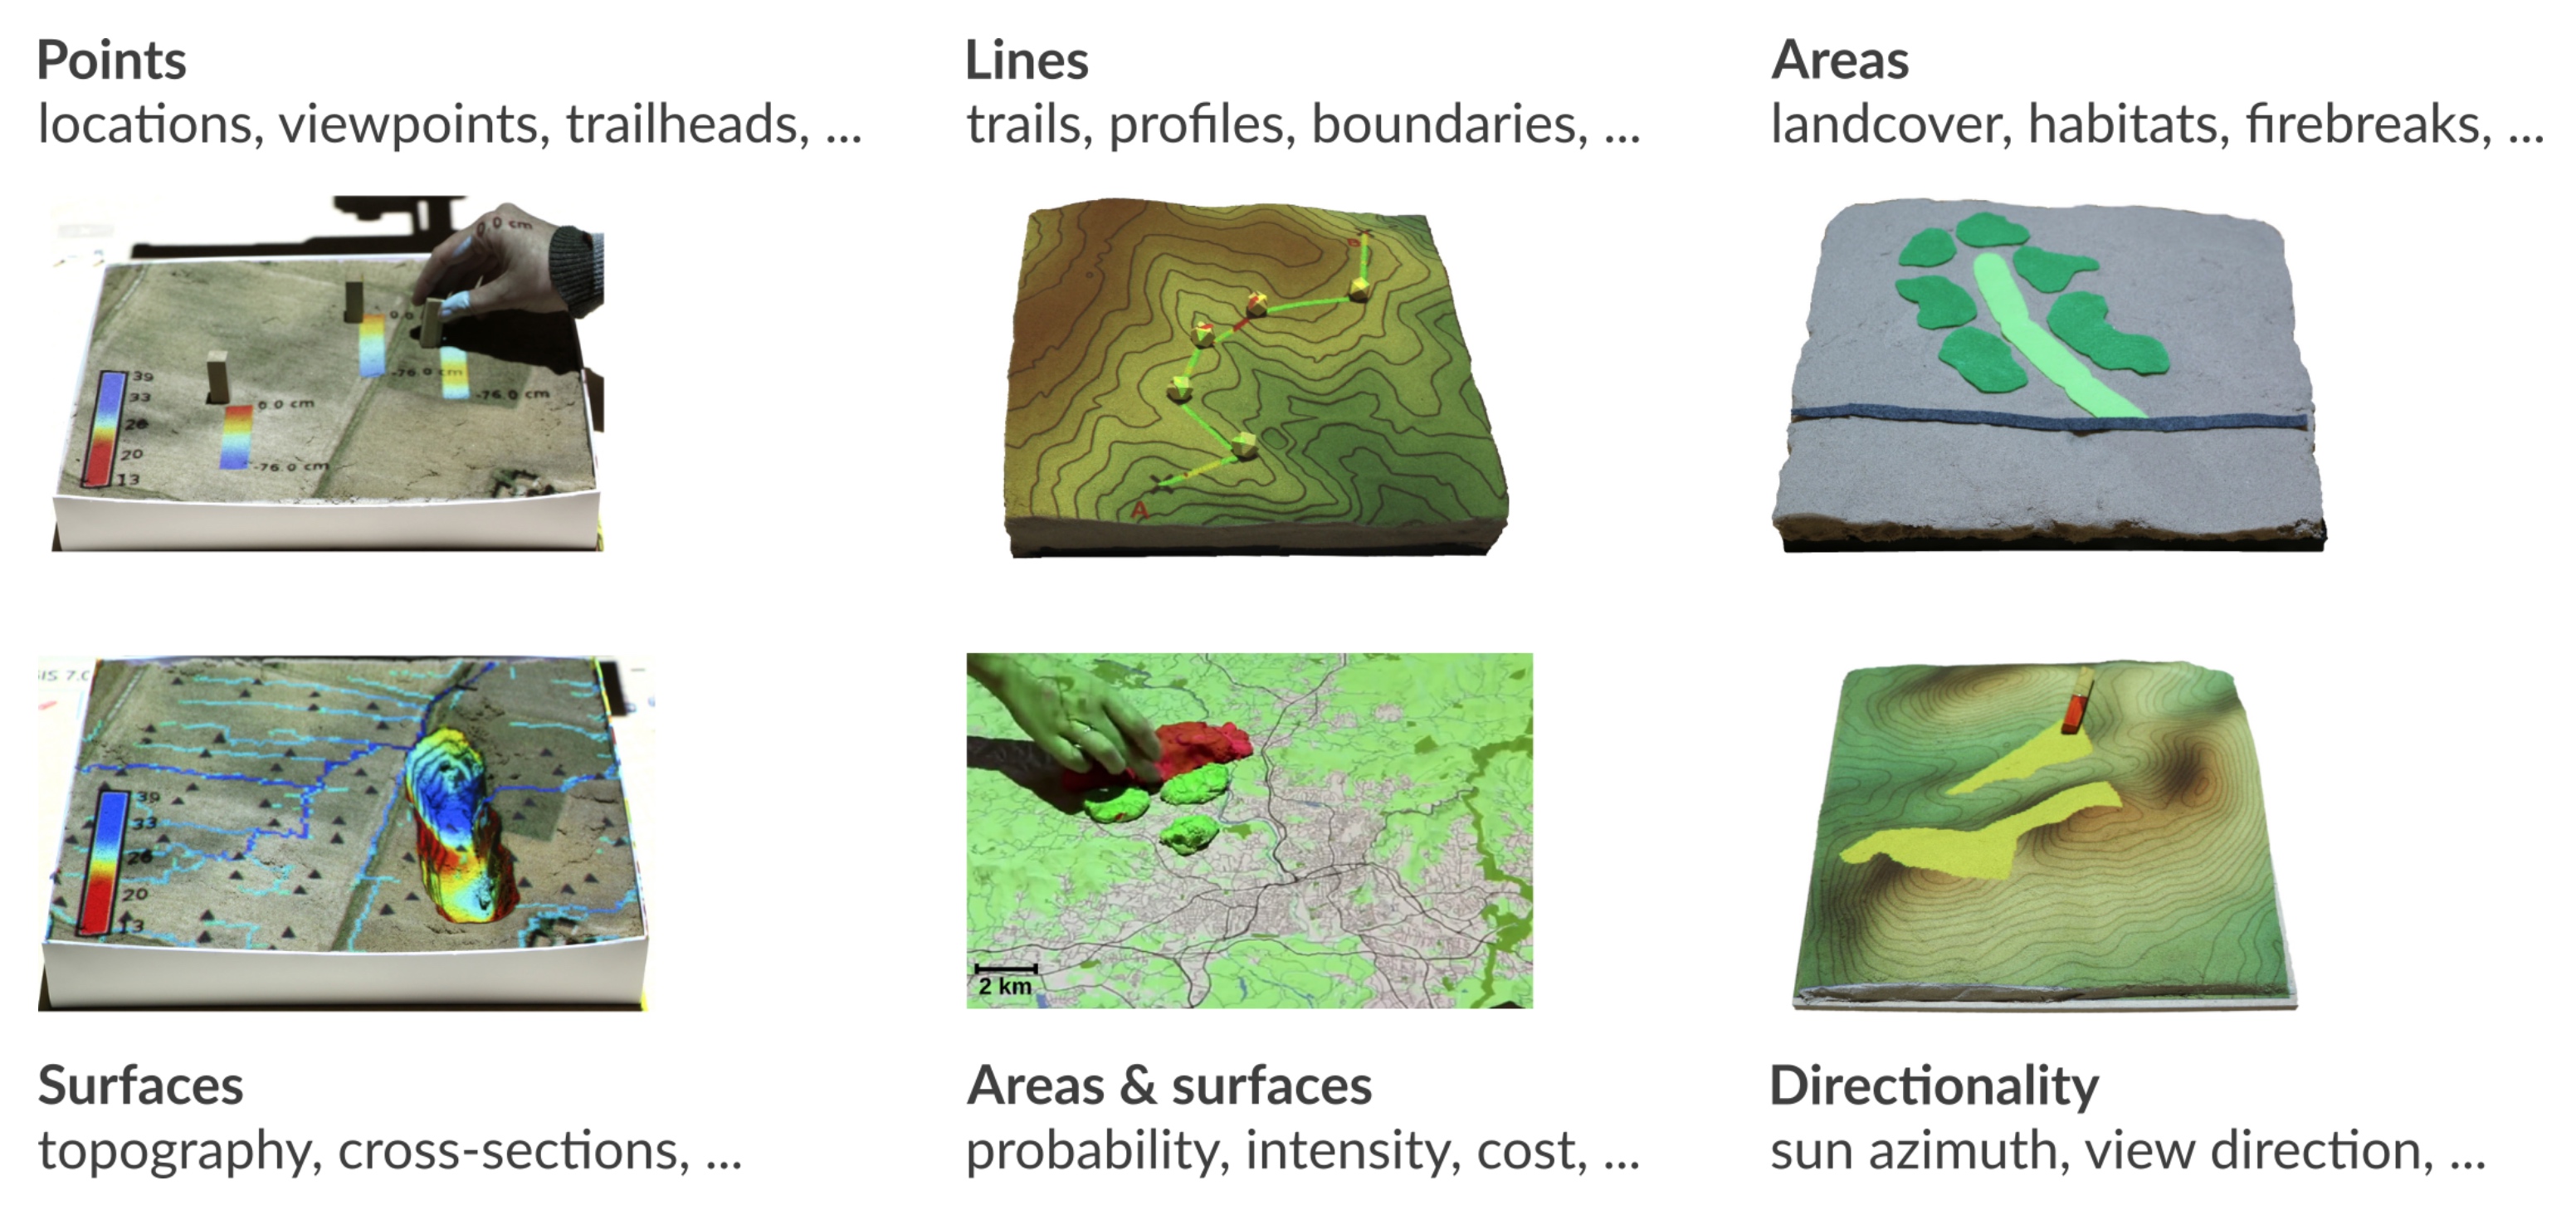
Interactions
Coupling with 3D rendering
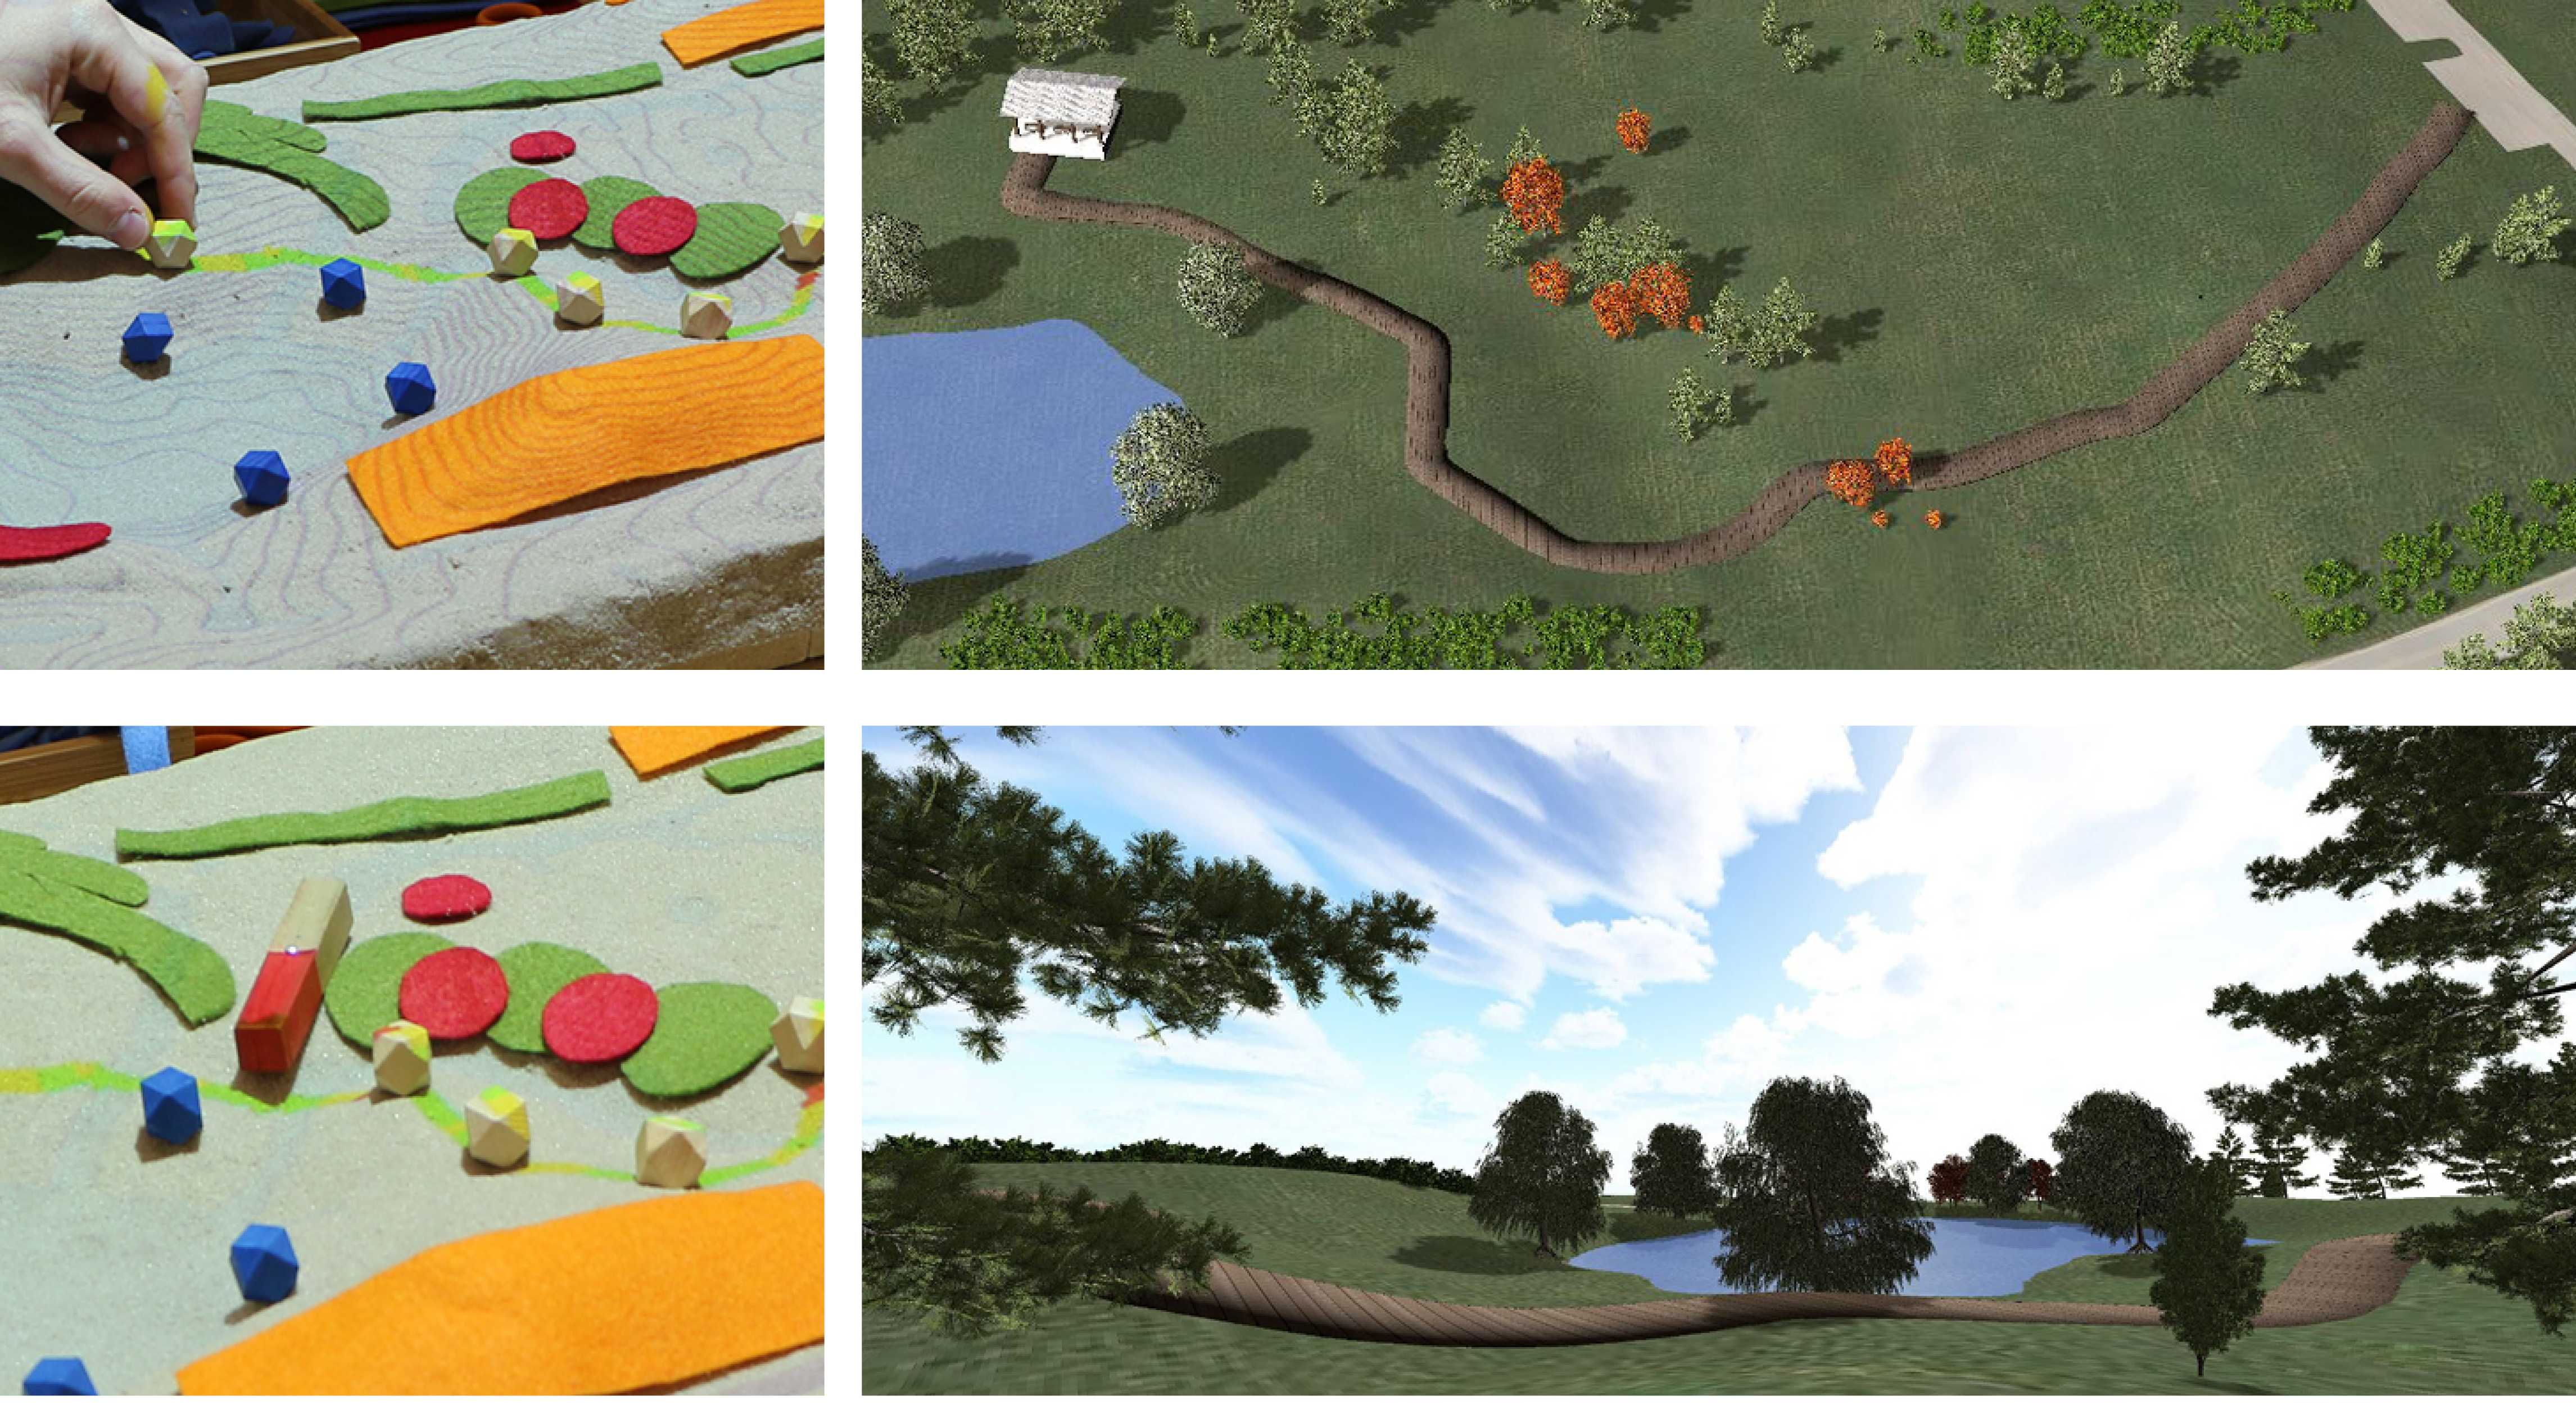
Design scenario analysis
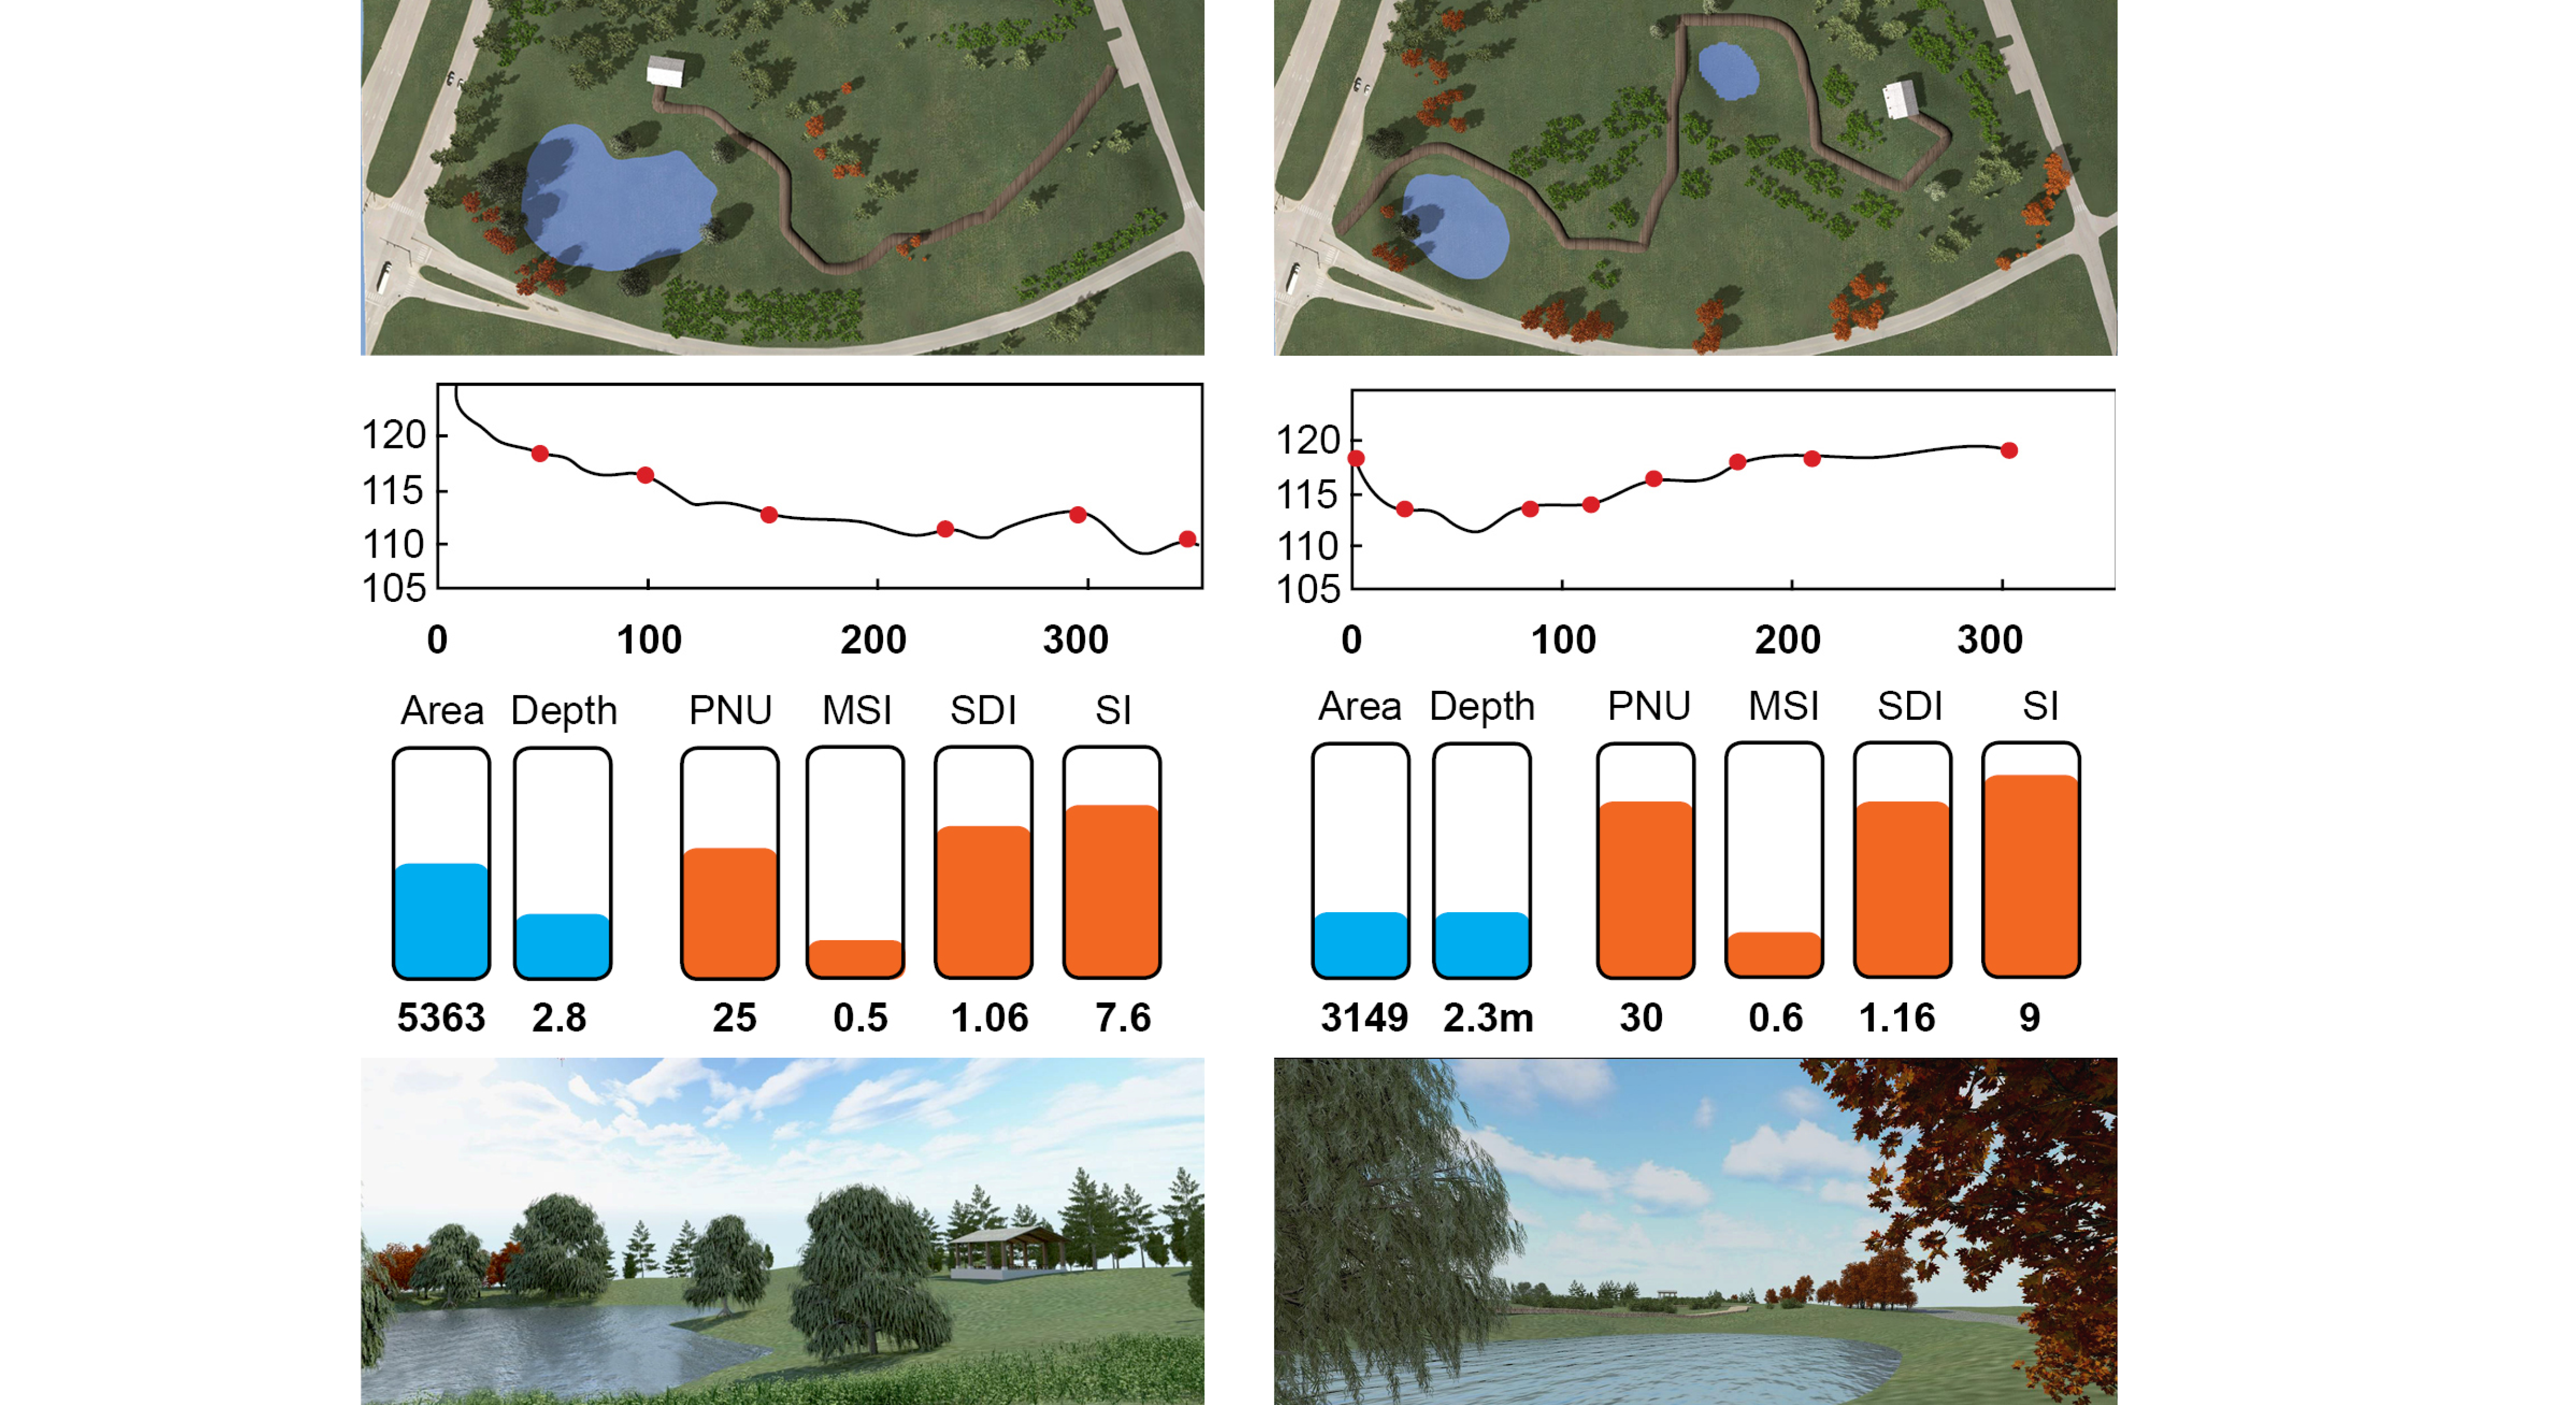
Tangible Landscape for designers and researchers
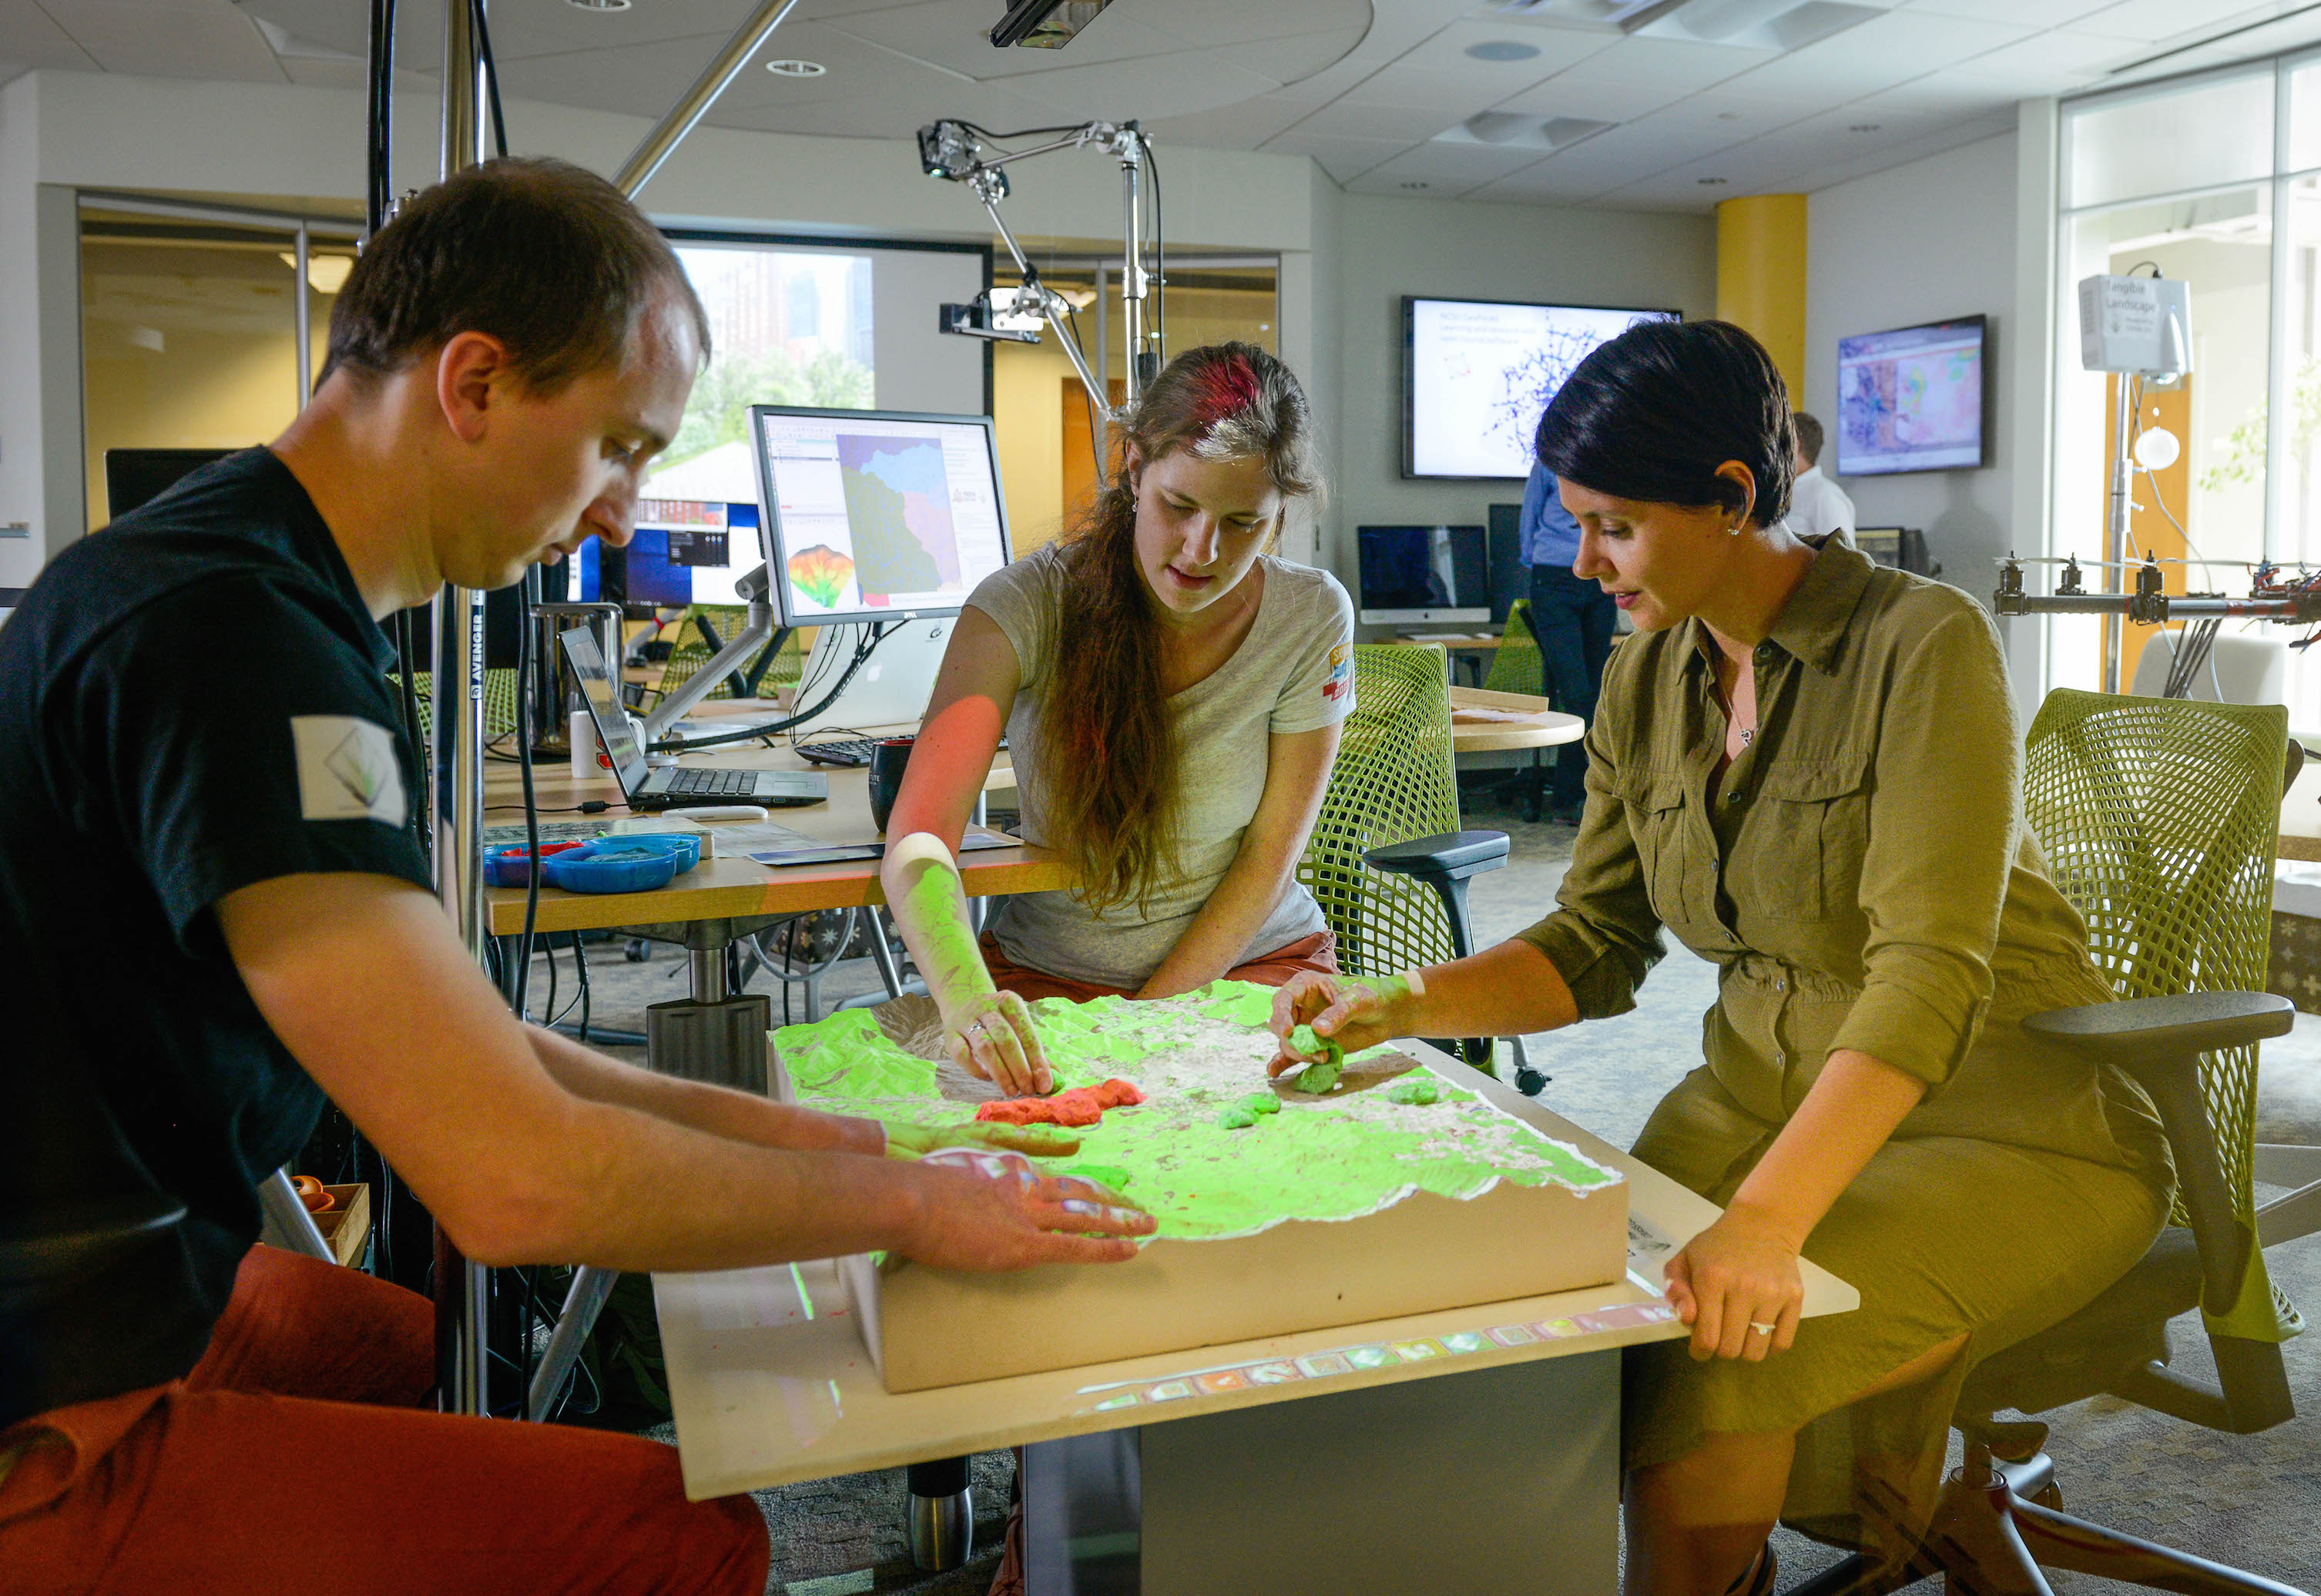
Tangible Landscape for education

Tangible Landscape for communities
Platform for decision-making and science communication where people of different backgrounds can interact.
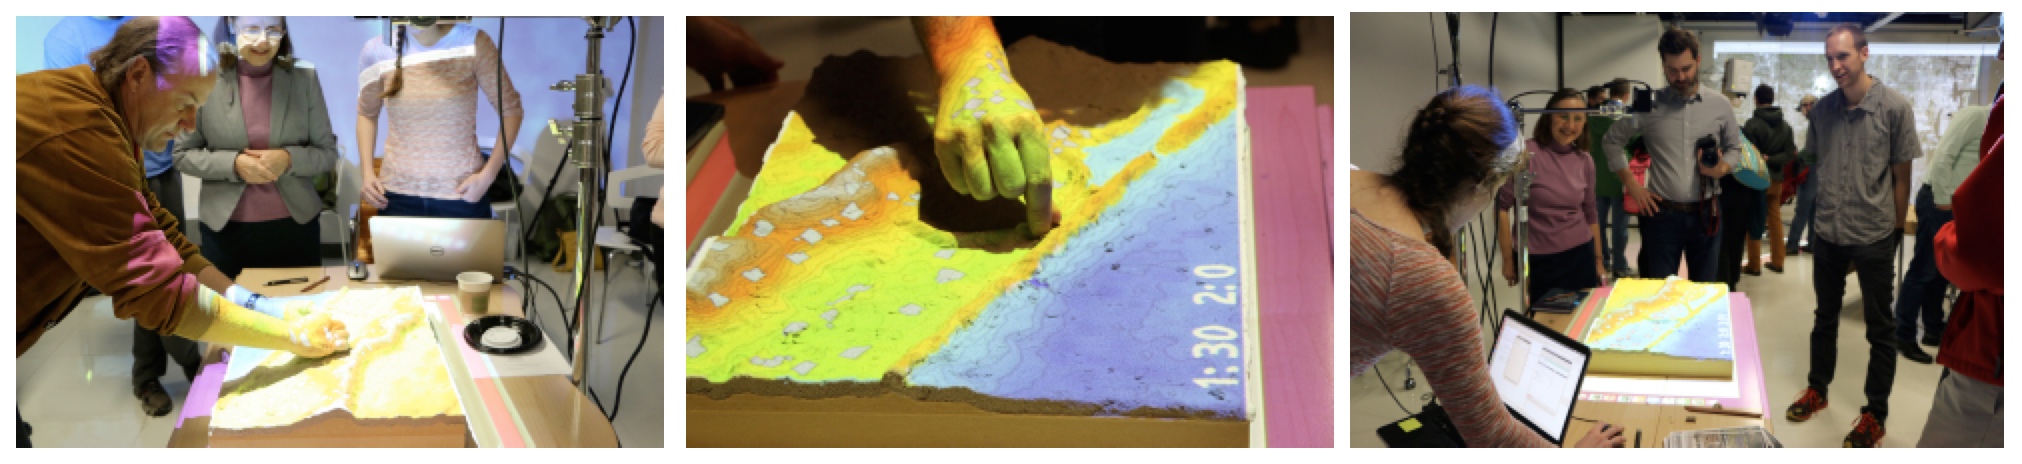
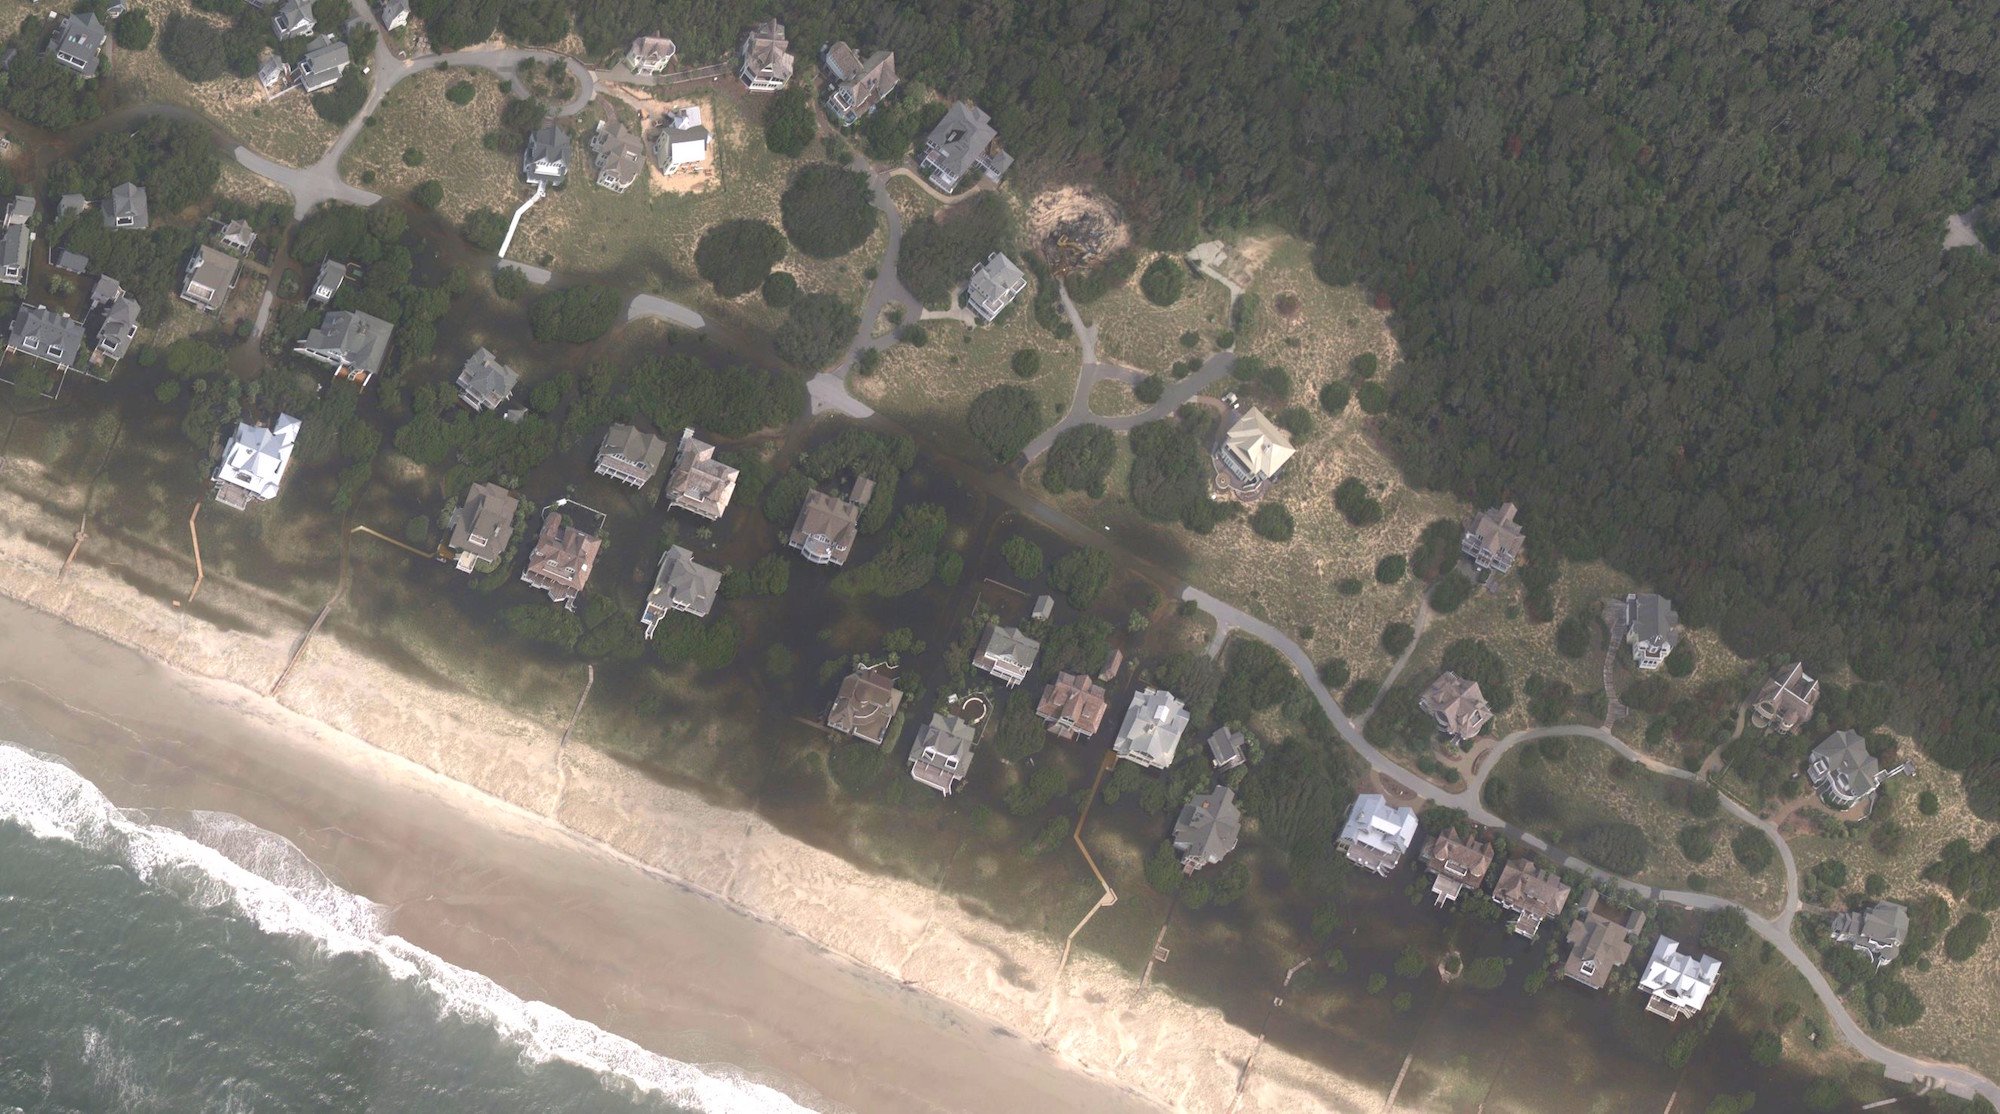
Storm surge defenses serious game
Actual coastal flooding post Florence
Open Science
Developing open source software and contributing to OSGeo projects:
GRASS GIS https://grass.osgeo.org/
Tangible Landscape tangible-landscape.github.io
Open access educational material:
NCSU GeoForAll Lab Courses and Workshops https://geospatial.ncsu.edu/geoforall/courses.html
Thank You!
Tangible Landscape website:
tangible-landscape.github.io
TL wiki: github.com/tangible-landscape/grass-tangible-landscape/wiki
NCSU GeoForAll Lab
