Geospatial data models
Helena Mitasova
GIS/MEA582 Geospatial Modeling and Analysis NCSU
Learning objectives
- understand and perform raster data resampling
- modify vector data representation
- convert between raster and vector data models
- find and use data repositories, wms services
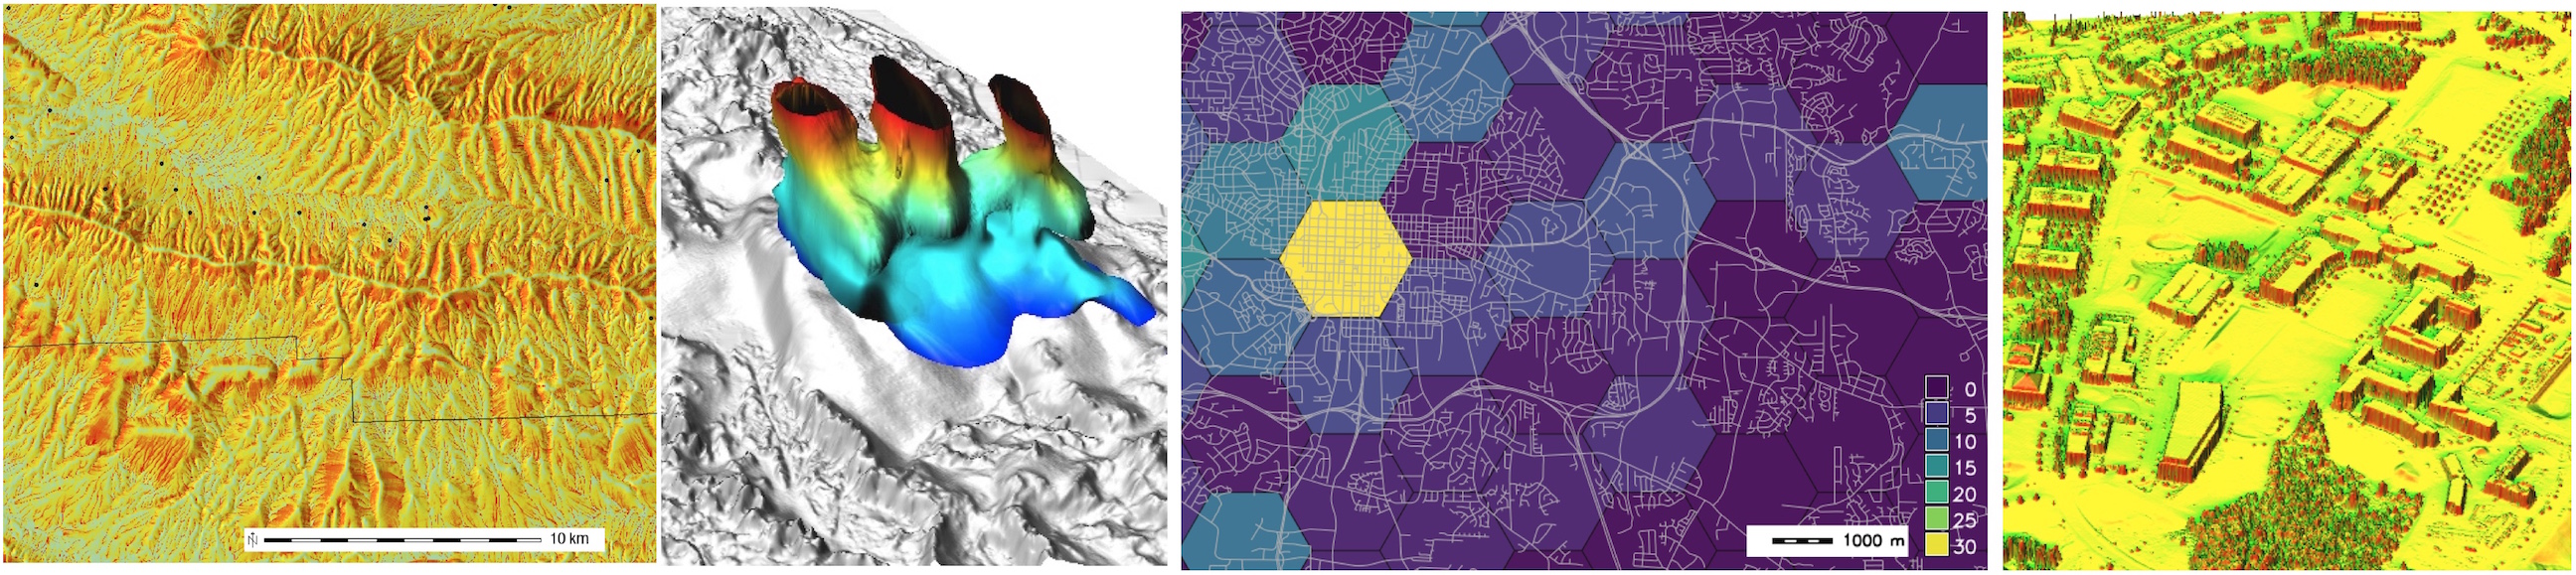
Geospatial data models
Mapped data, results of modeling or analysis are represented in GIS using
- raster (regular grid) data model
- vector (feature) data model
- specialized representations: meshes
Modifications of data representation
- Changing raster resolution, e.g., when model inputs are rasters at different resolutions
- Changing vector geometry type, e.g., when model input requires different geometry than given data (points instead of lines)
Raster data - changing resolution
Resolution: size of the grid cell (pixel) in map units (m)
- continuous fields: interpolation
- the higher resolution raster values are interpolated using the values of the neighboring lower resolution cells
- methods: bi-linear, bi-cubic, spline.
- discrete raster data: nearest neighbor resampling
- assigns the higher resolution cell the same value as the nearest lower resolution cell
- resulting raster has only the values present in the input raster
Increasing resolution: continuous
Elevation at 30m resolution resampled to 10m resolution
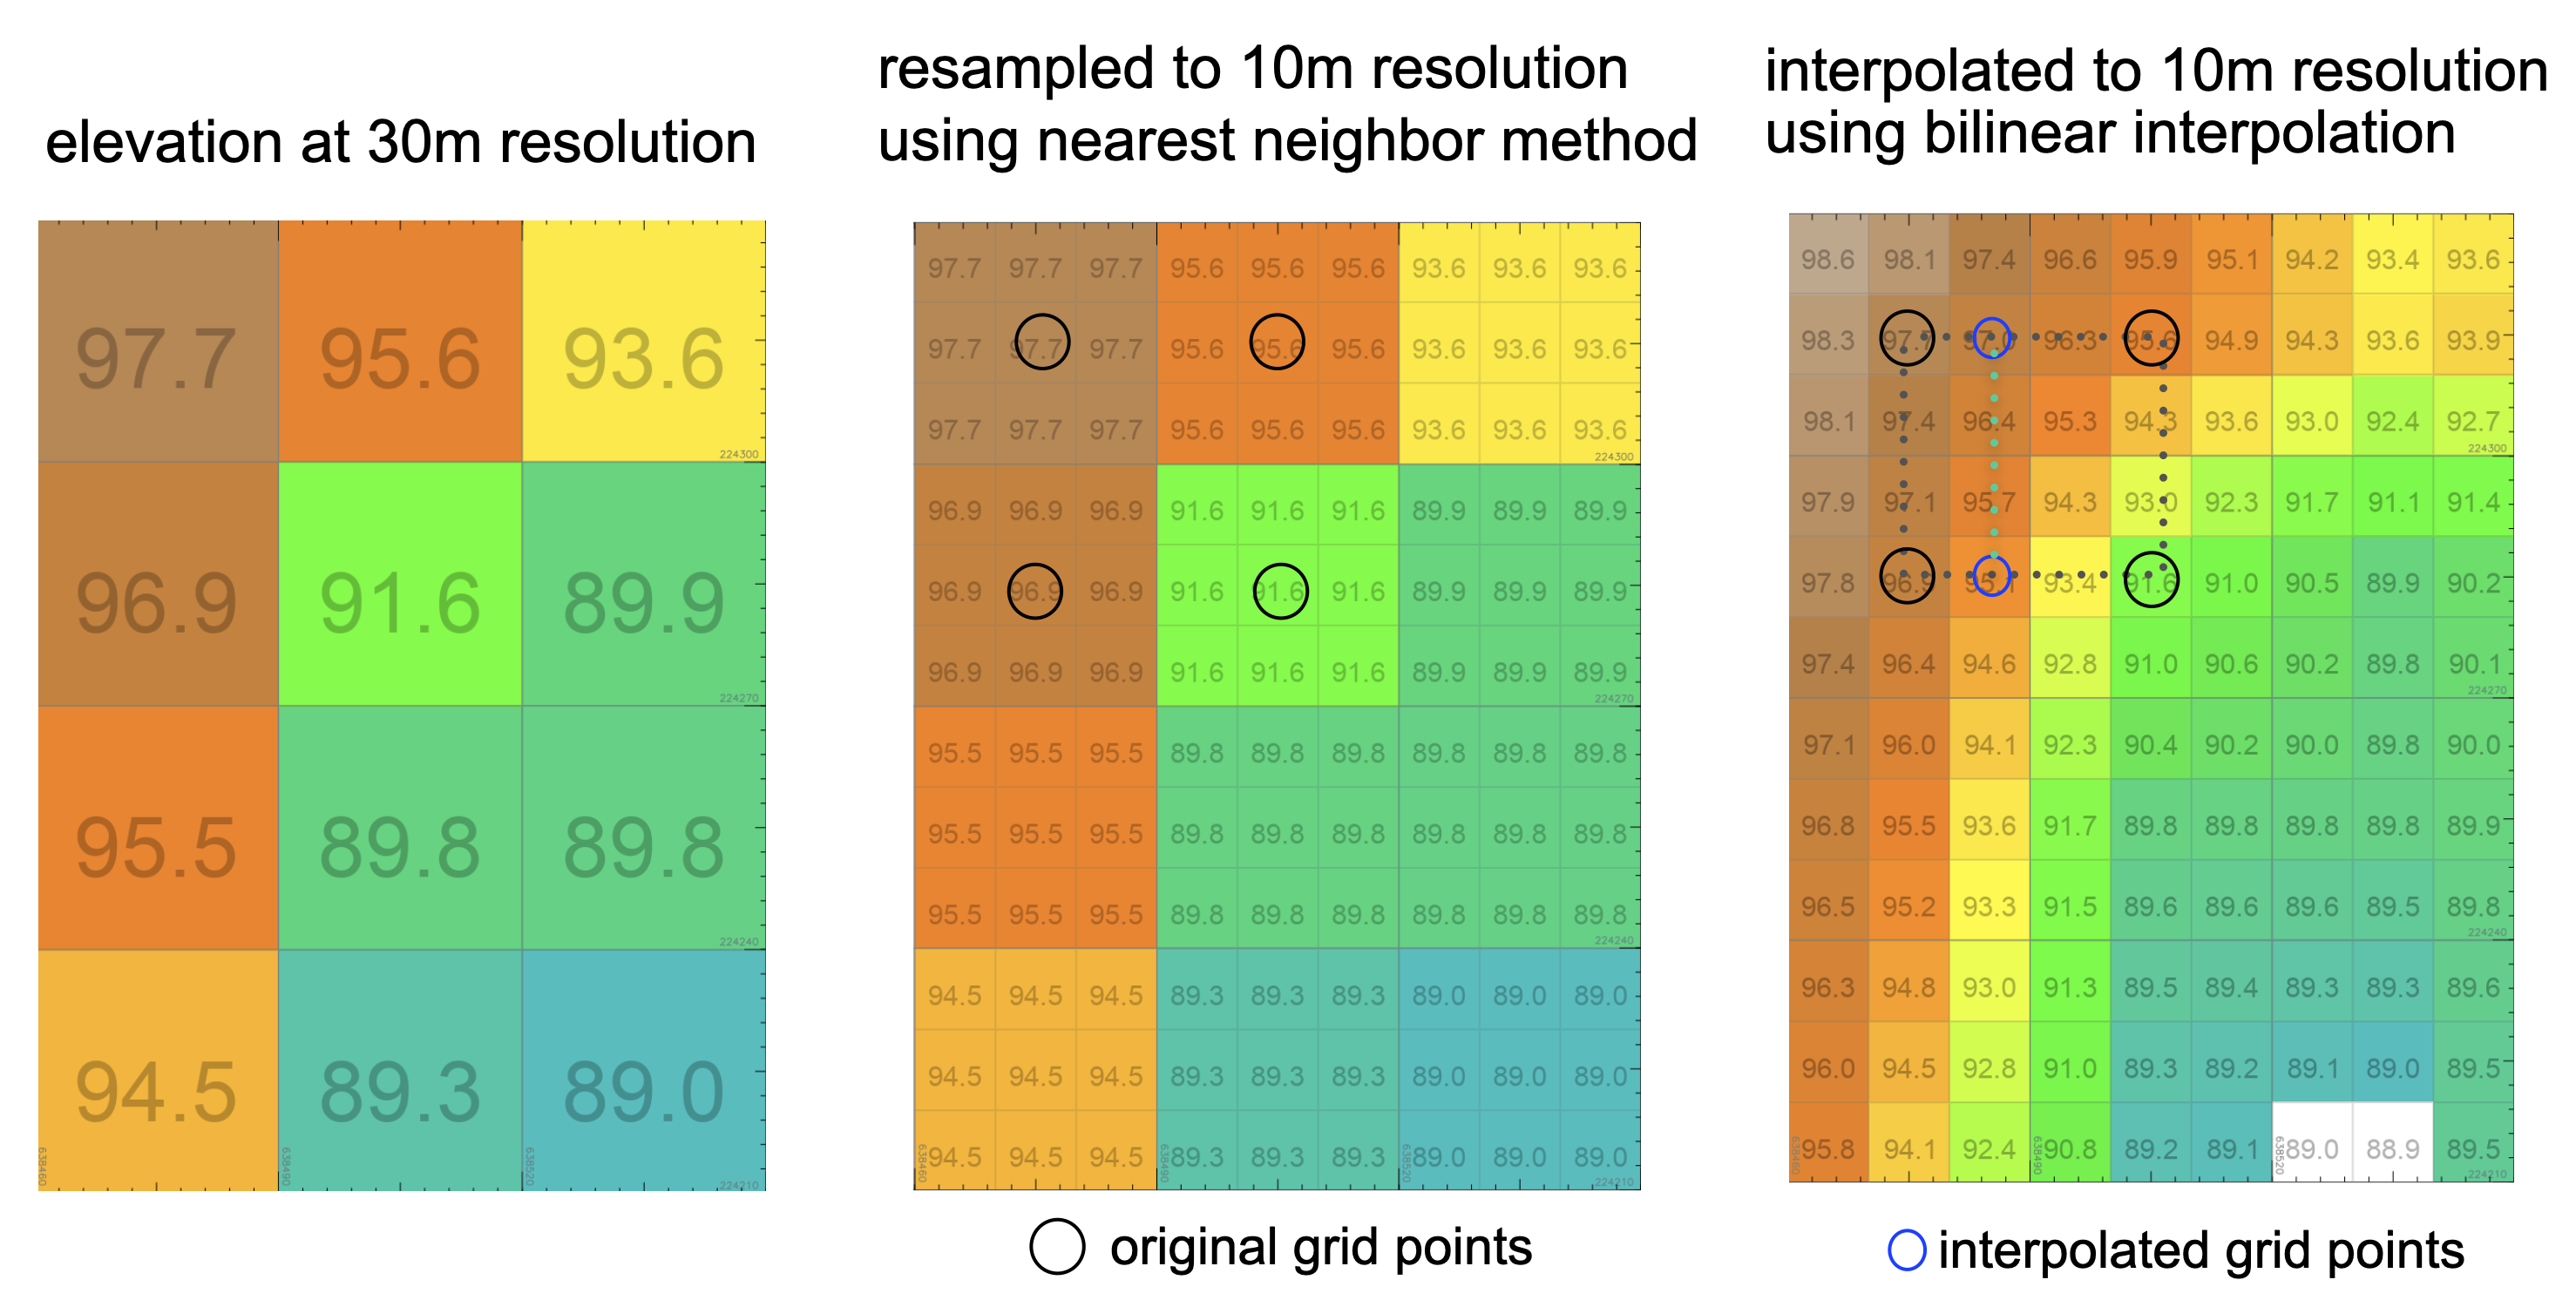
Nearest neighbor creates "flats" in the resampled DEM, interpolation preserves smooth surface.
See equations for bi-linear interpolation
Increasing resolution: discrete
Geology at 30m resolution resampled to 10m resolution
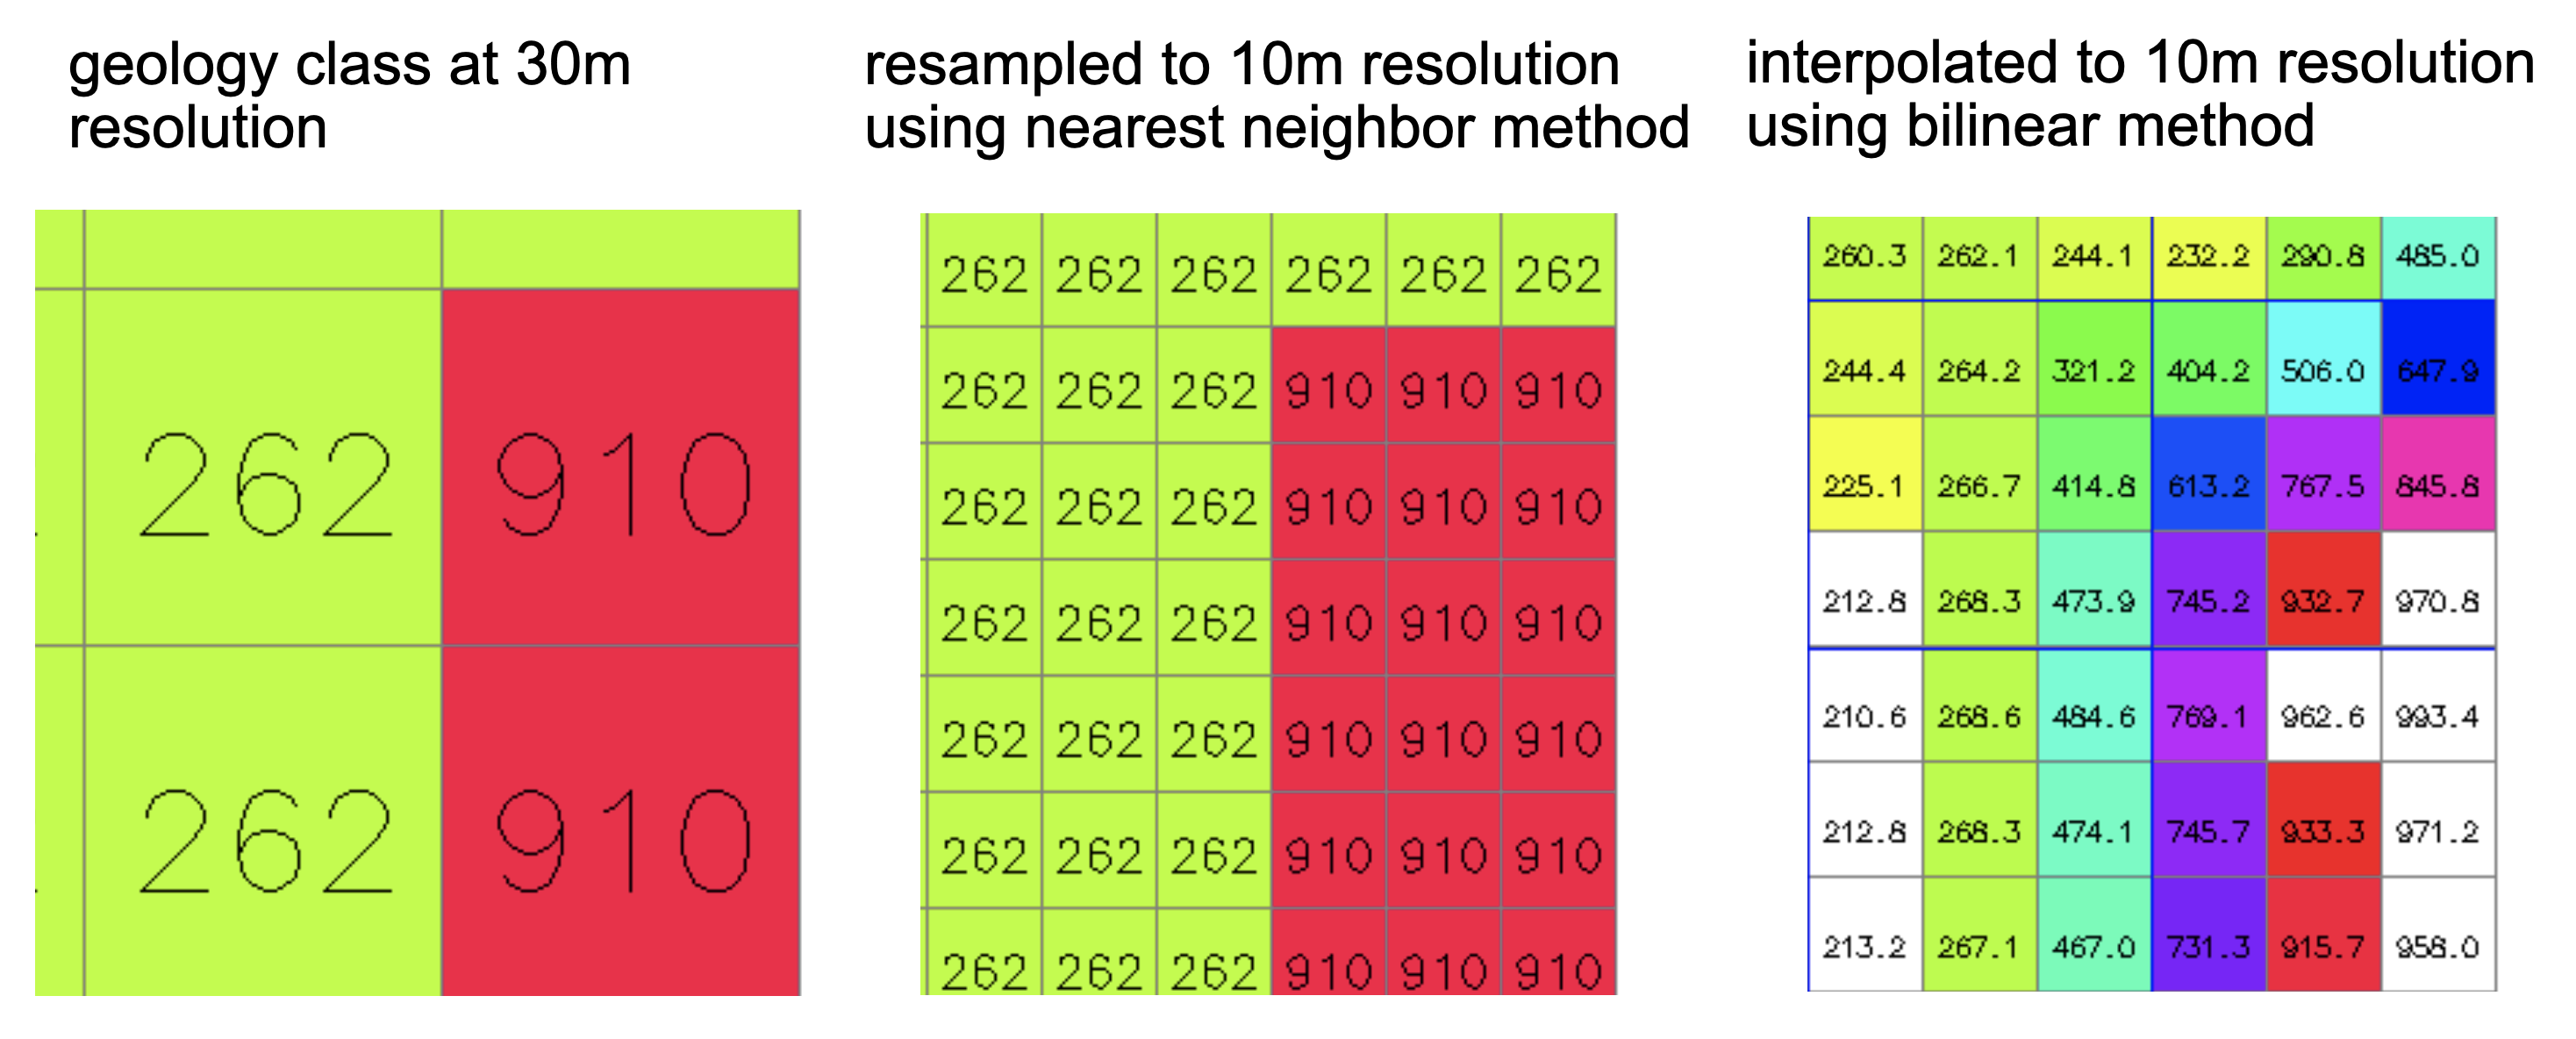
Raster values are classes of observed geology
Increasing resolution: compare
Effect of resampling / reinterpolation on the results
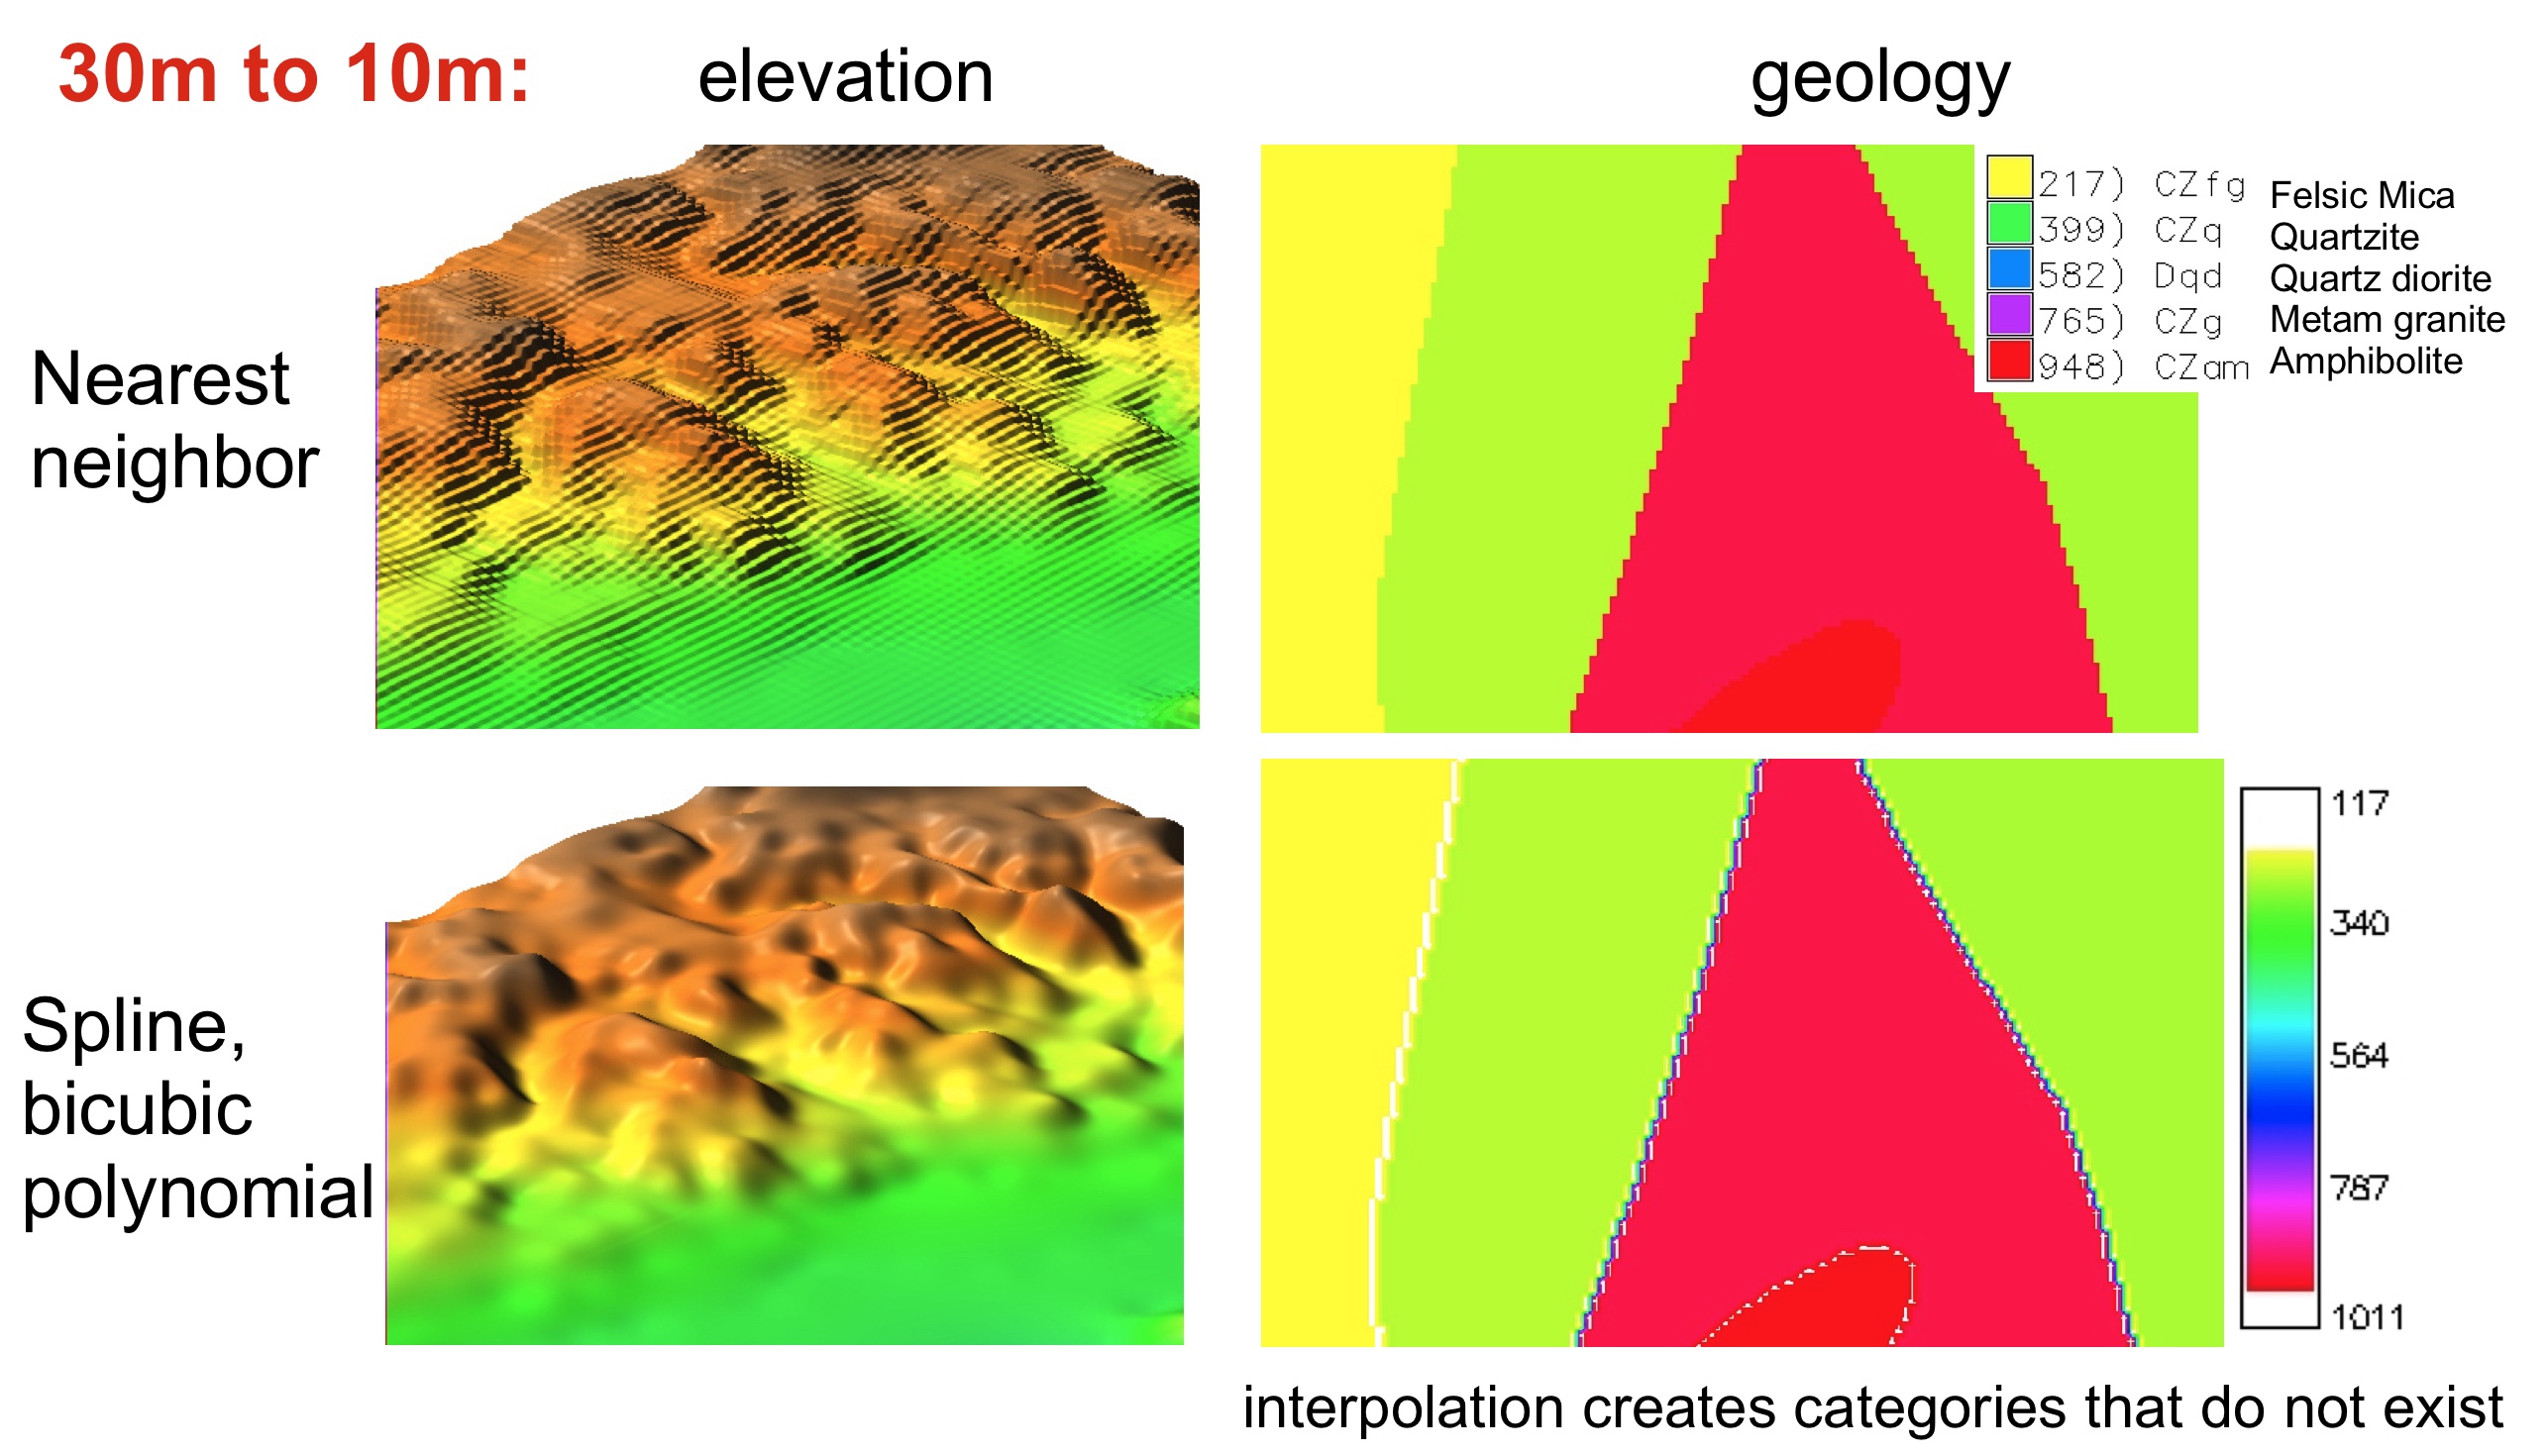
More complex downscaling techniques using additional variables and machine learning
may be needed if the difference in resolution is large
Decreasing resolution
Continuous data: nearest neighbor, average, min, max, or re-interpolation is used
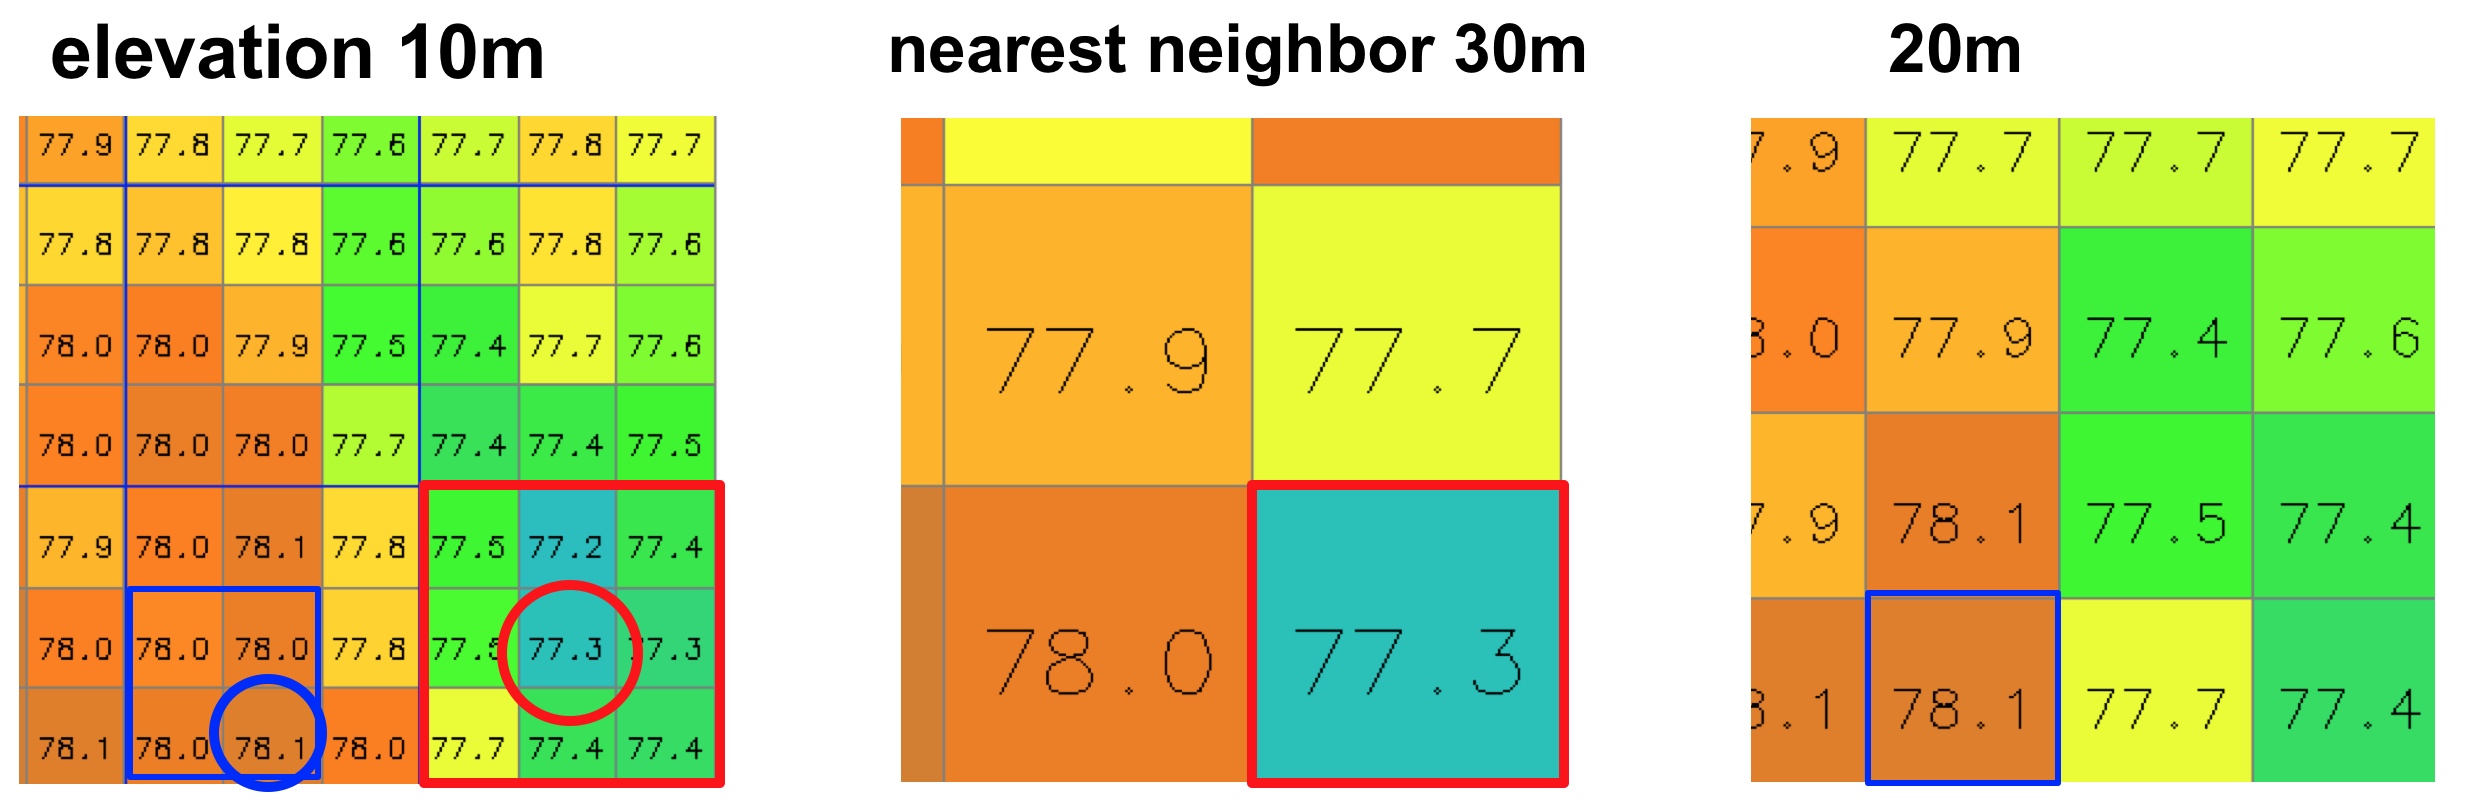
Nearest neighbor resampling of 10m DEM to 30m and 20m DEMs
Decreasing resolution
Discrete data: nearest neighbor resampling, mode (most common or majority class)
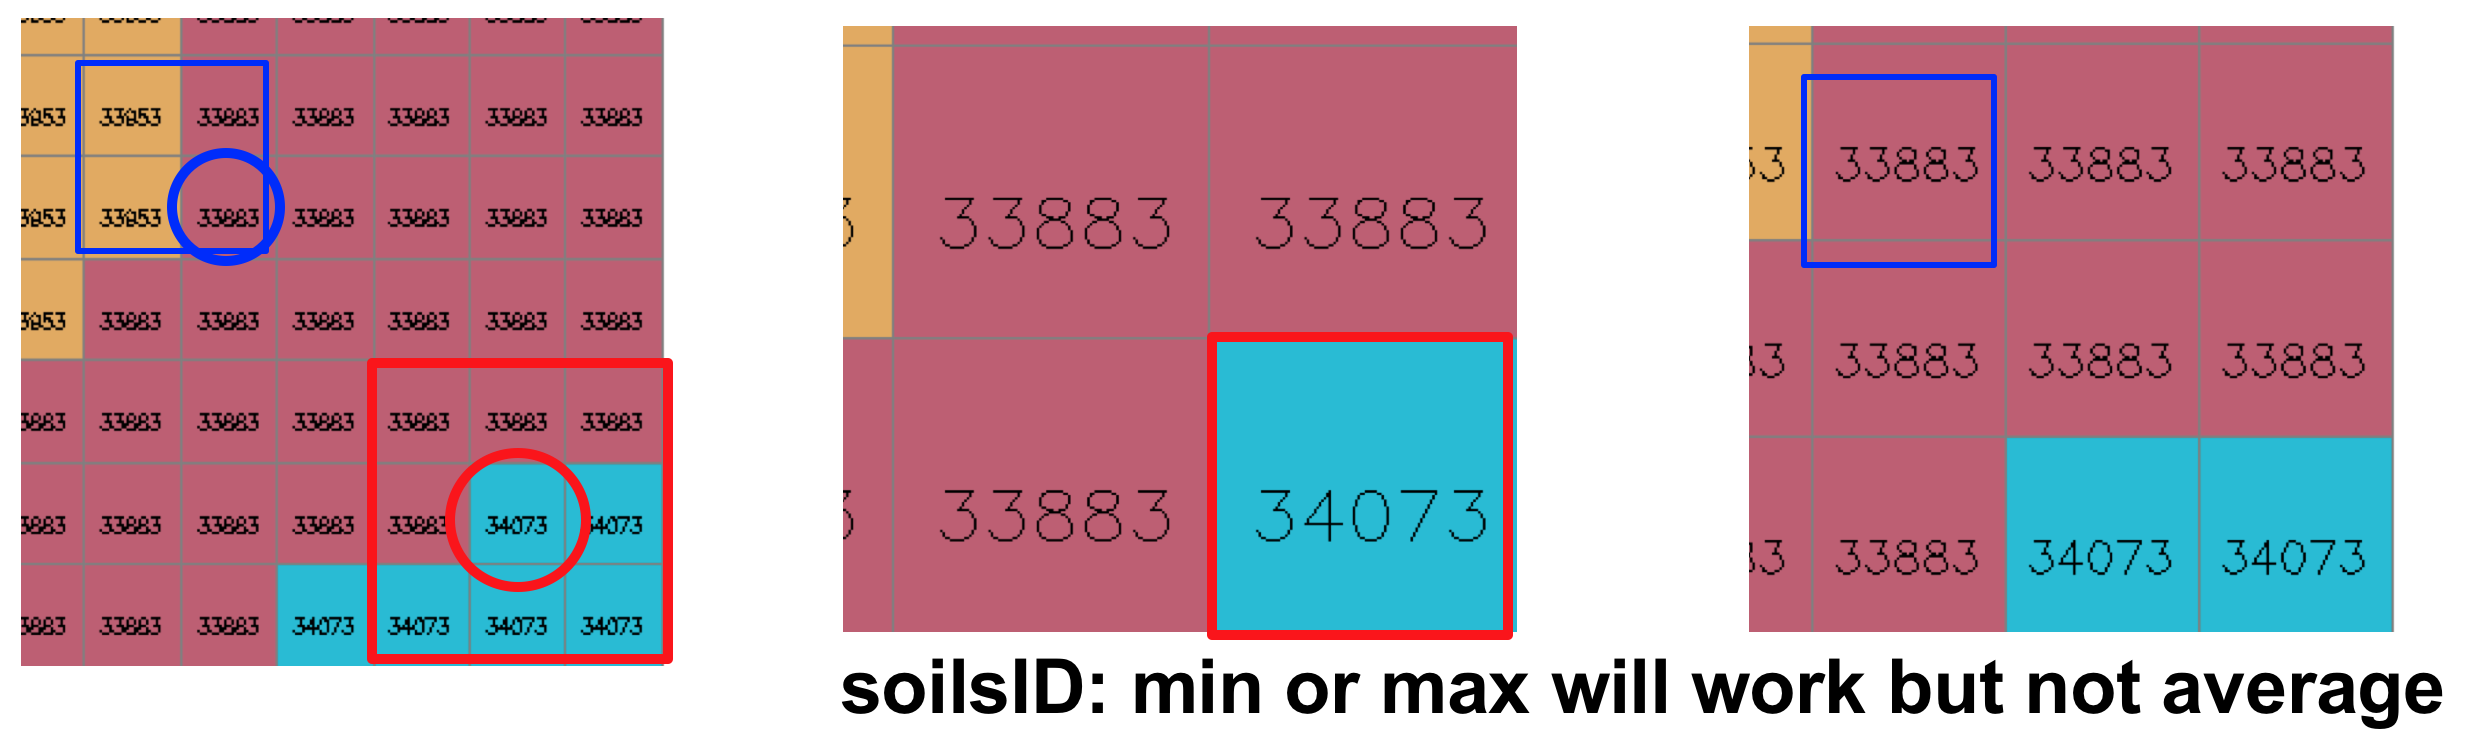
Nearest neighbor resampling of 10m soil typemap to 30m and 20m maps
Modifying vector data
- Converting vector data type
- lines to points, areas to lines or points
- points to lines: network building or interpolation may be needed
- usually preserves the shape
- Generalization
- simplifying geometry while preserving important information
- both data geometry and type can be modified
- line to simplified line, polygon to simplified polygon or point
- selecting subset of features
- important when combining local, state and national scale data
Changing vector data type
Data geometry is not modified, but subset is extracted and stored in a different data structure
Topology building is required for conversions point to line, line to polygon
Conversion between data models
- vector to raster
- continuous: spatial interpolation (covered by a separate topic)
- discrete: nearest neighbor
- raster to vector
- continuous: point sampling, isolines
- discrete: nearest neighbor, grid center or boundary
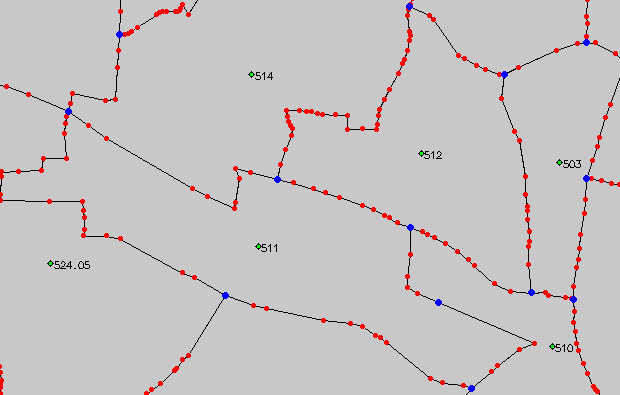
Continuous: vector to raster data
Spatial interpolation is used to compute raster representation from point measurements
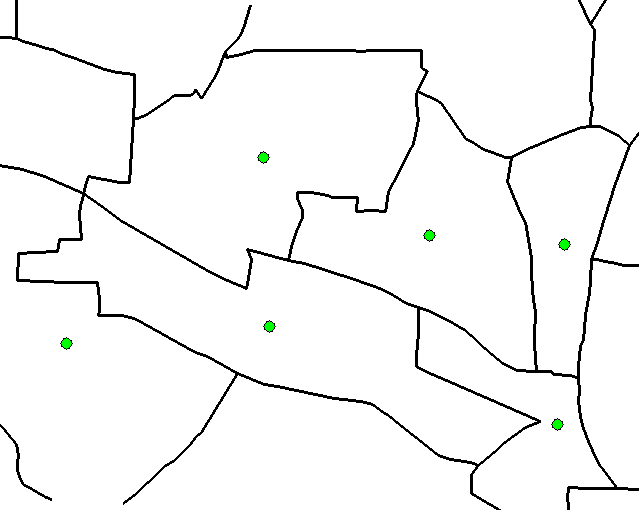
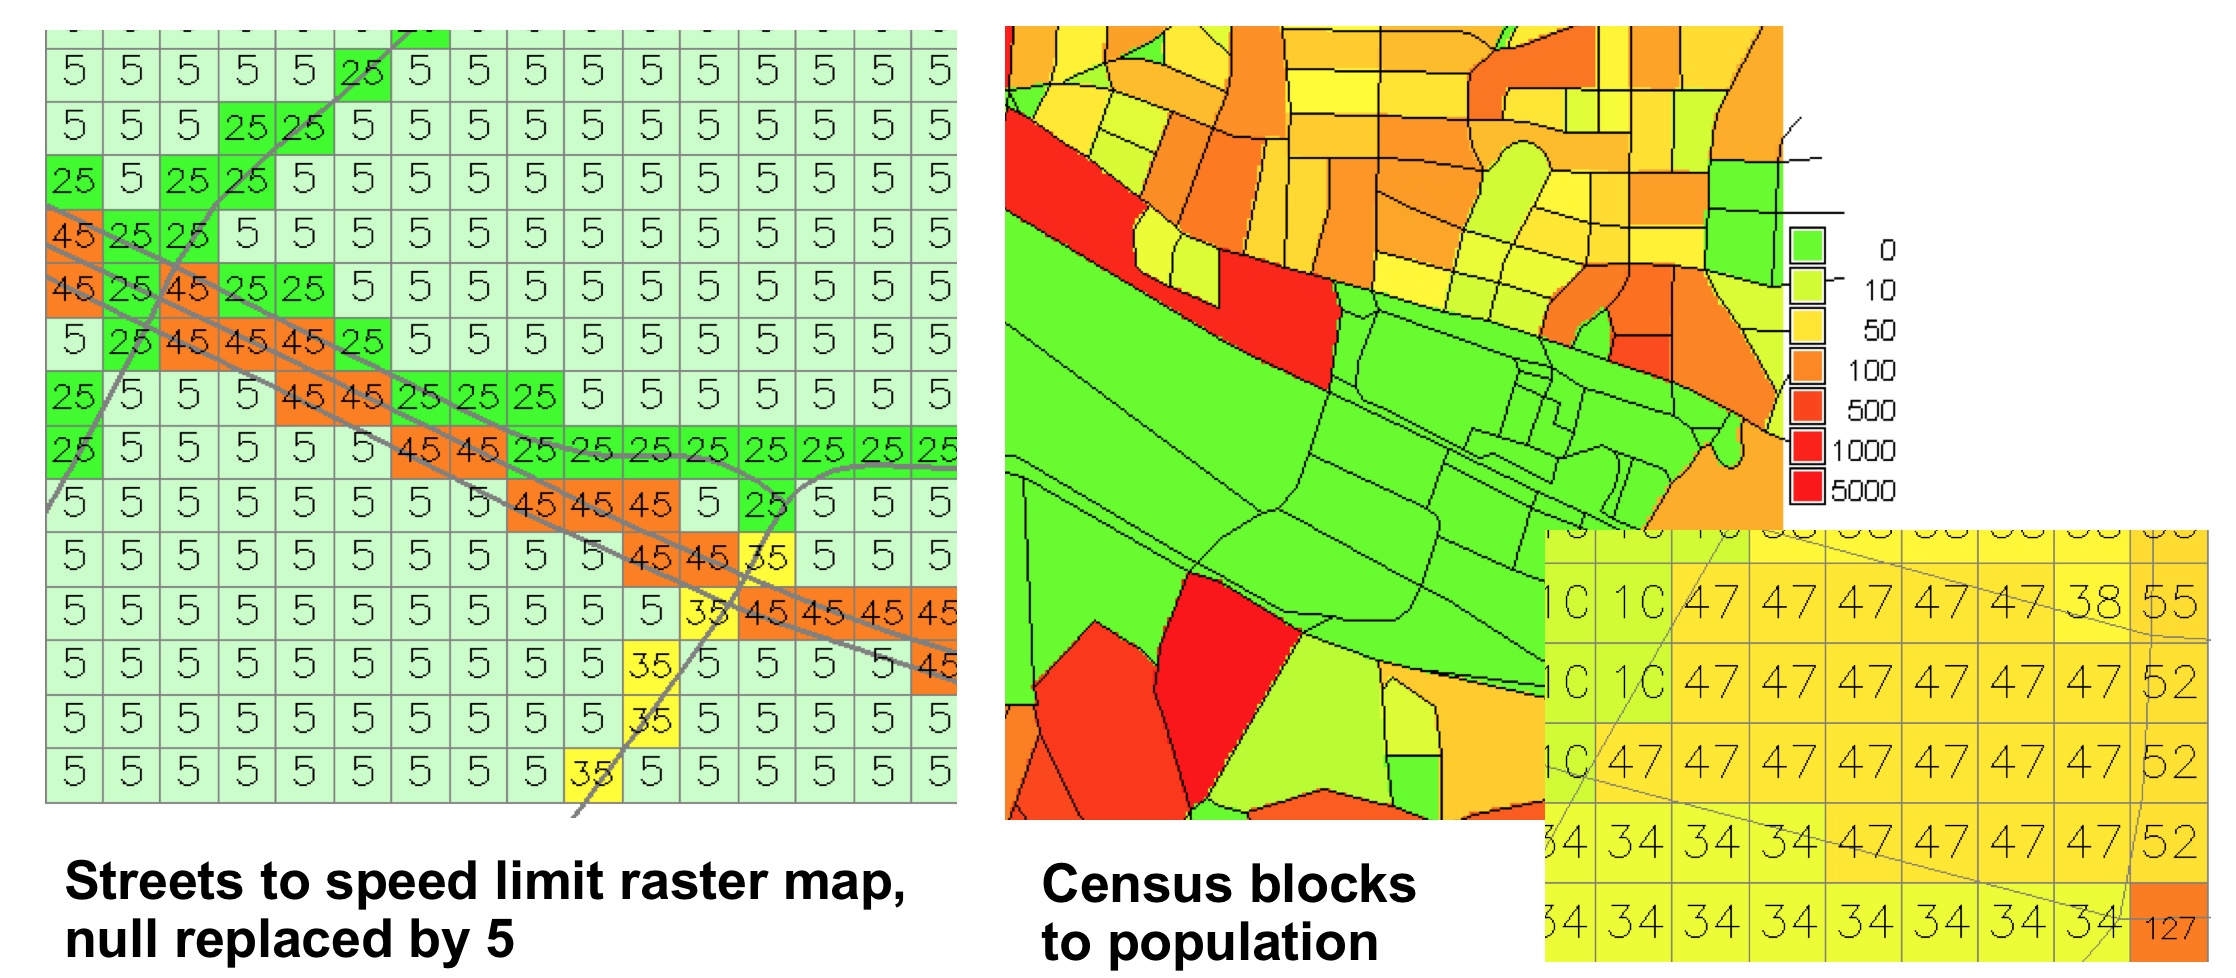
Discrete: vector to raster data
- lines, areas: nearest neighbor
- areas: attribute value applies to the entire polygon
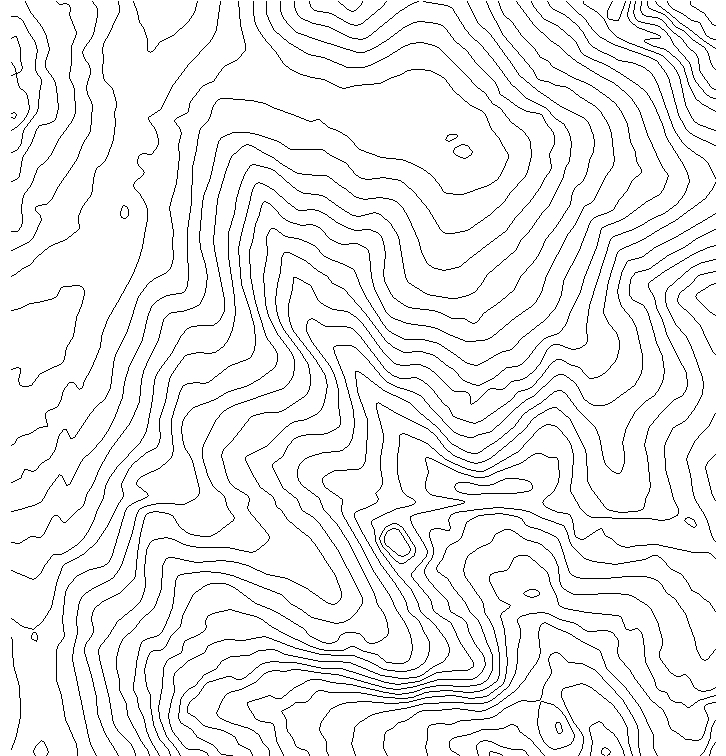
Raster to vector data
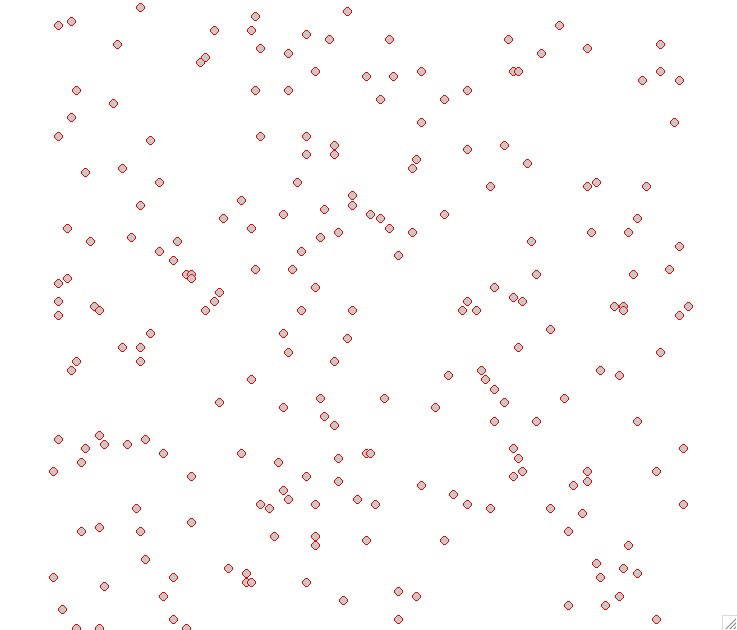
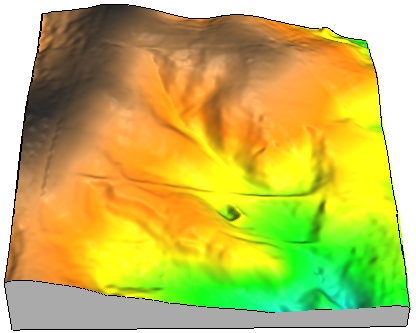
Continuous data: isolines, sampling points
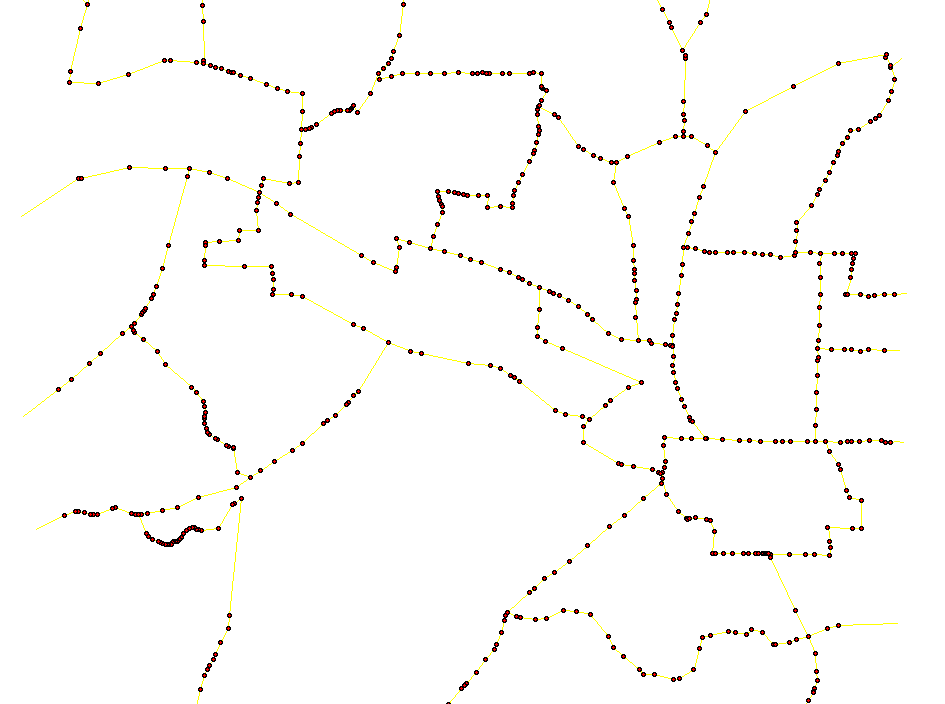
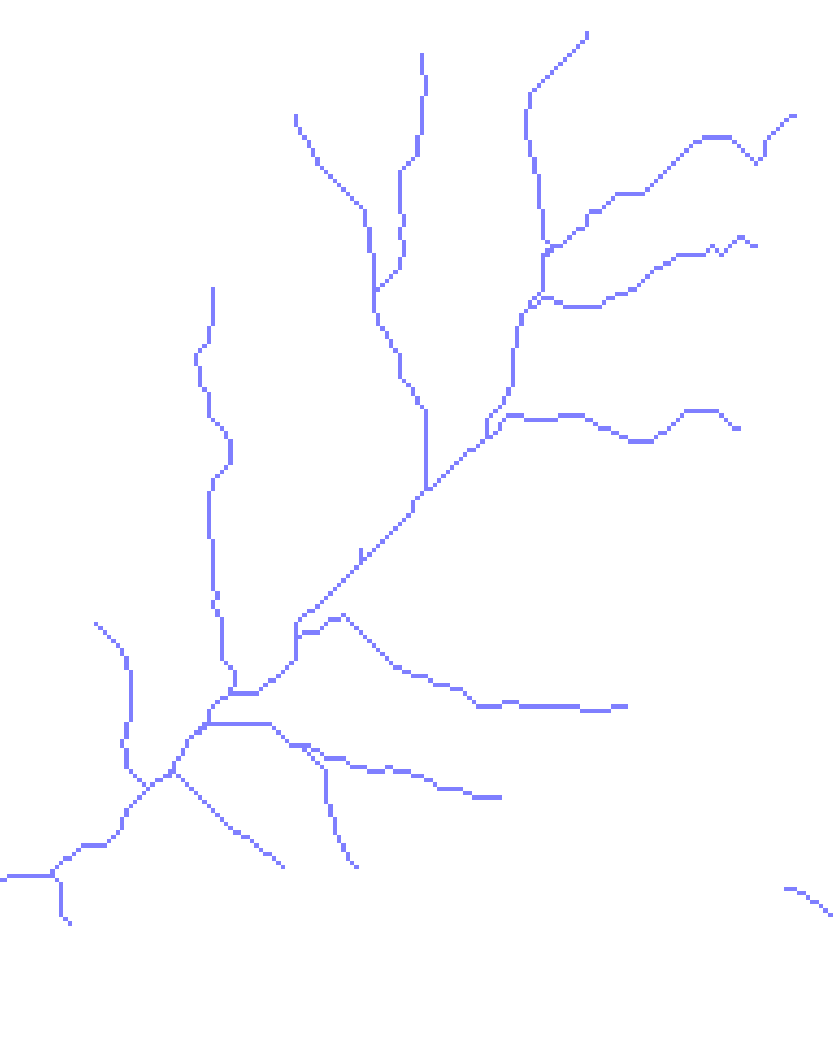
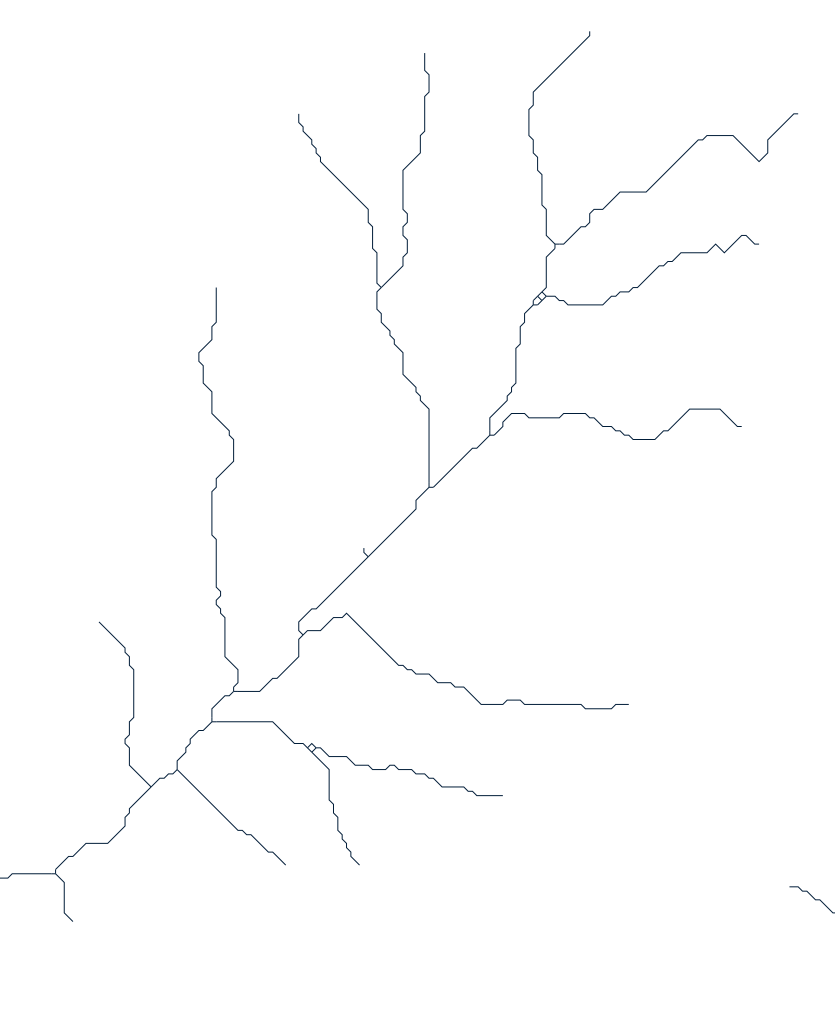
Raster to vector data
- points – centers of grid cells
- lines, polygon border lines: connected grid cell centers
- thinning and smoothing is often performed for lines
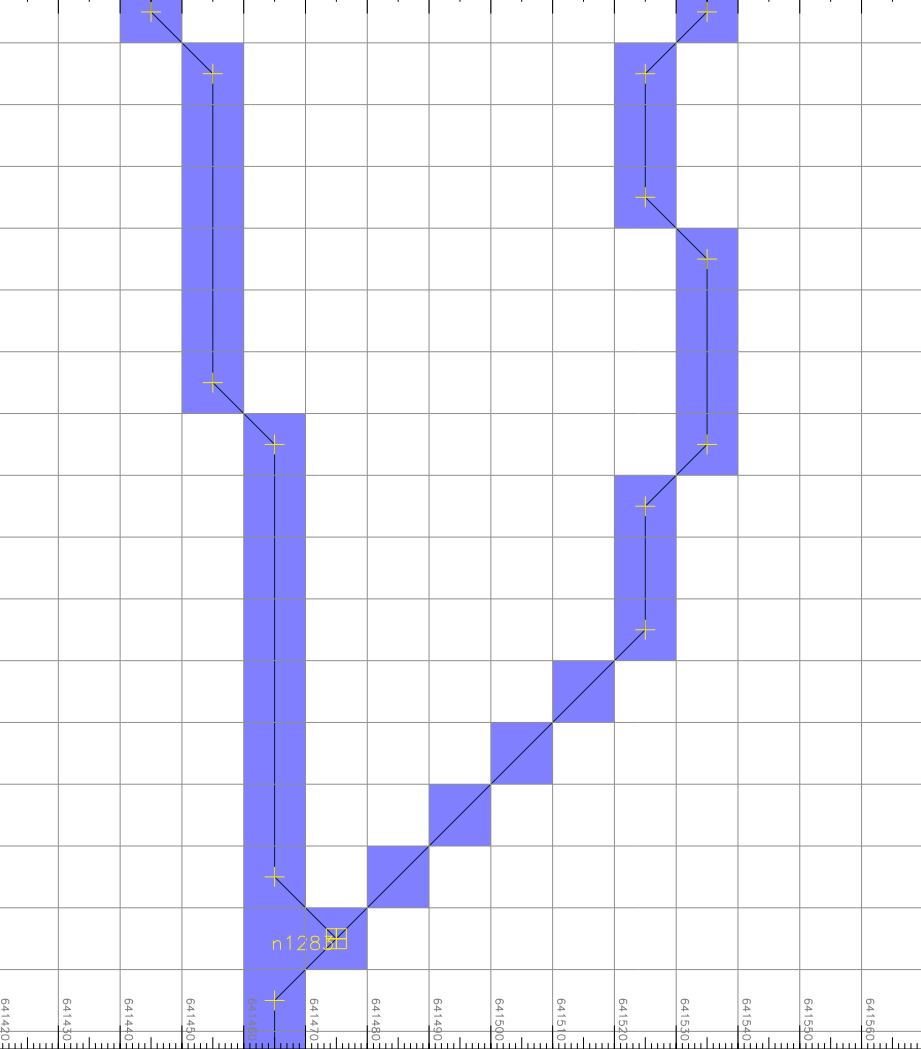
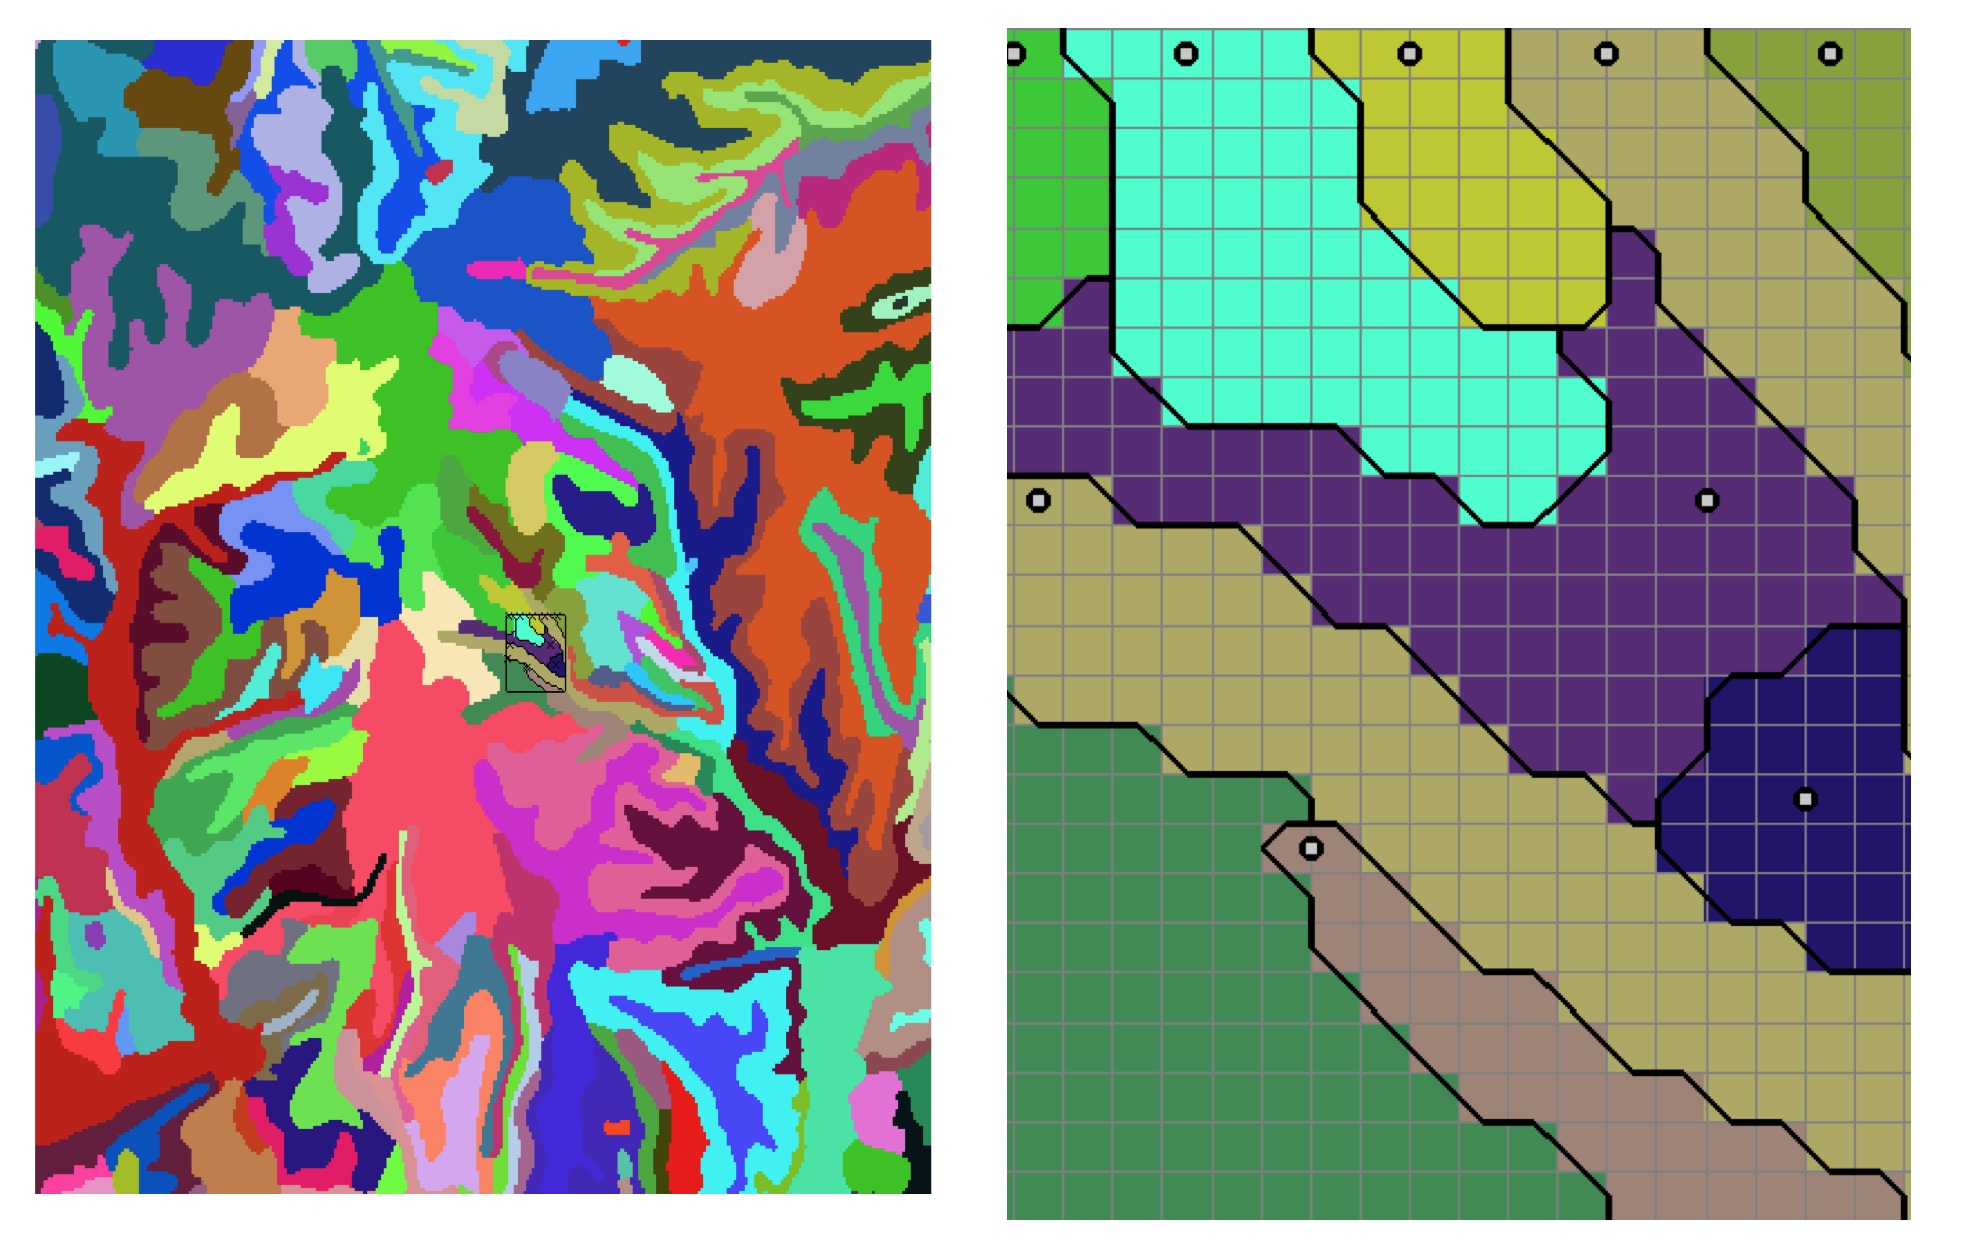
Raster to vector data
- areas – boundary, centroid, requires building topology
- connects points on grid cell boundary
Data repositories
Data repositories: WMS, WPS, WebGIS- Web mapping Service
- Web Processing Service
Summary
- raster and vector data models
- modifying raster and vector data representation
- converting between raster and vector data models
- data repositories, wms services