Analysis of UAS data processing results
Center for Geospatial Analytics at North Carolina State University
Objectives
- Understand how to interpret a processing report
- Compare errors and survey data from different flights
- Recognize differences in geoprocessing products generated by different software
- Understand significance of using GCPs in the processing and their impact on the final products
- Recognize what processing steps need to be modified in order to improve particular errors
Objectives
- Understand what causes the ‘Bowl effect’ and know the solutions to fix it
- Execute simple terrain measurements in Agisoft Photoscan
Flights Oct. 6th 2015
Flight Feb. 6th 2018
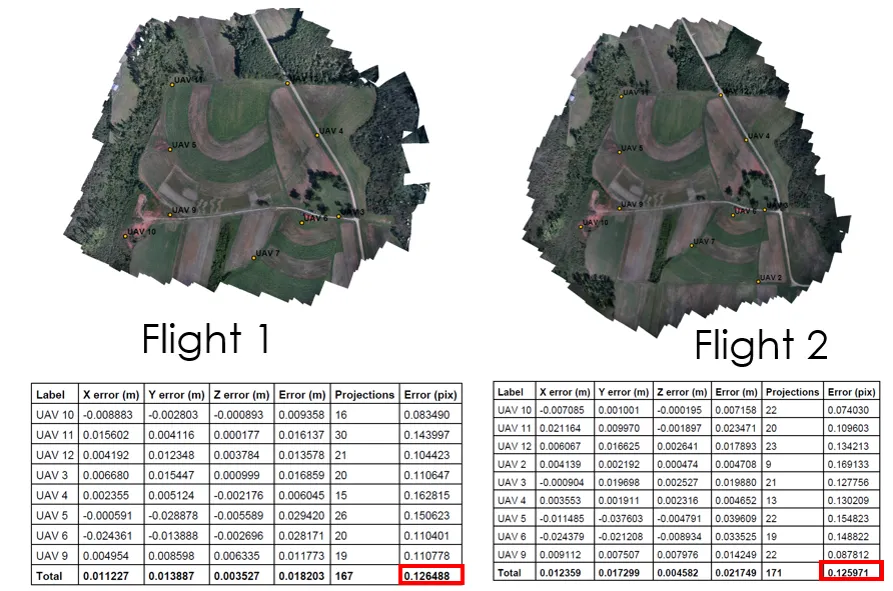
Flights Oct. 6th 2015
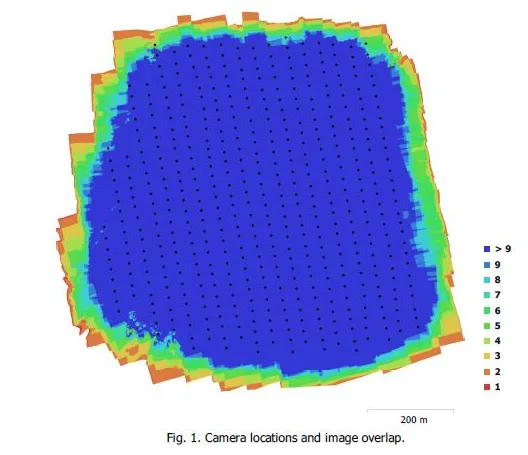
Analyzing the processing report
Includes:
- Orthophoto and digital elevation model sketch;
- Camera parameters and survey scheme
- Tie points data export (matching points and panoramas)
- Image overlap statistics
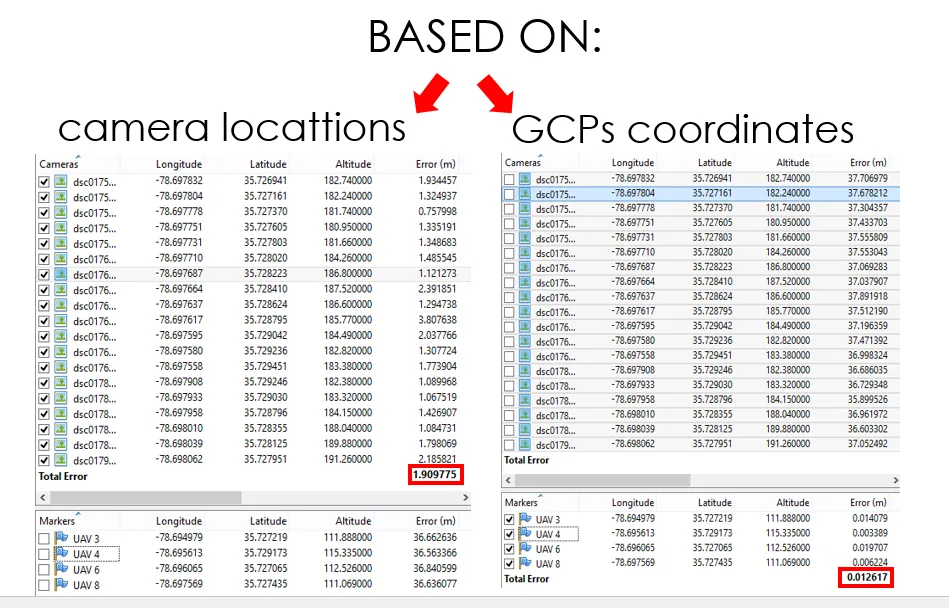
- Camera positioning error estimates
- Ground control point error estimates
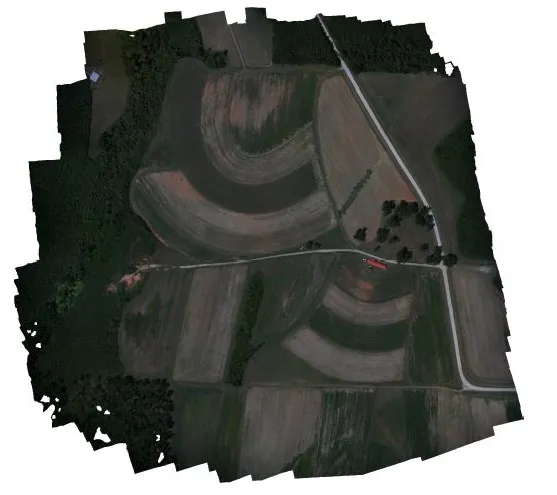
Orthophoto
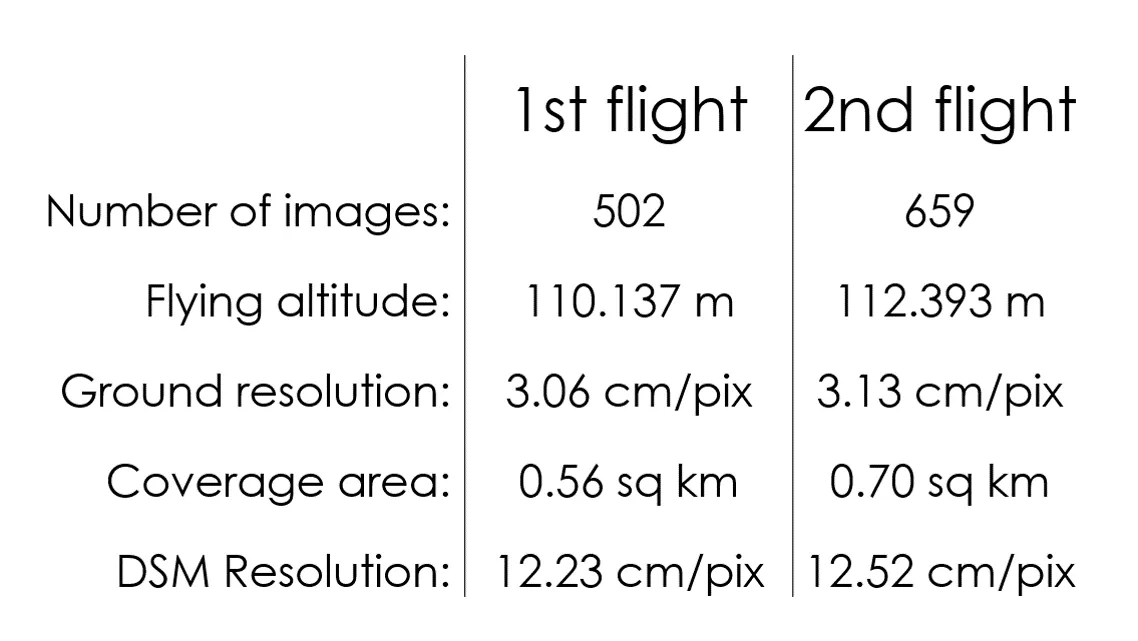
Survey data
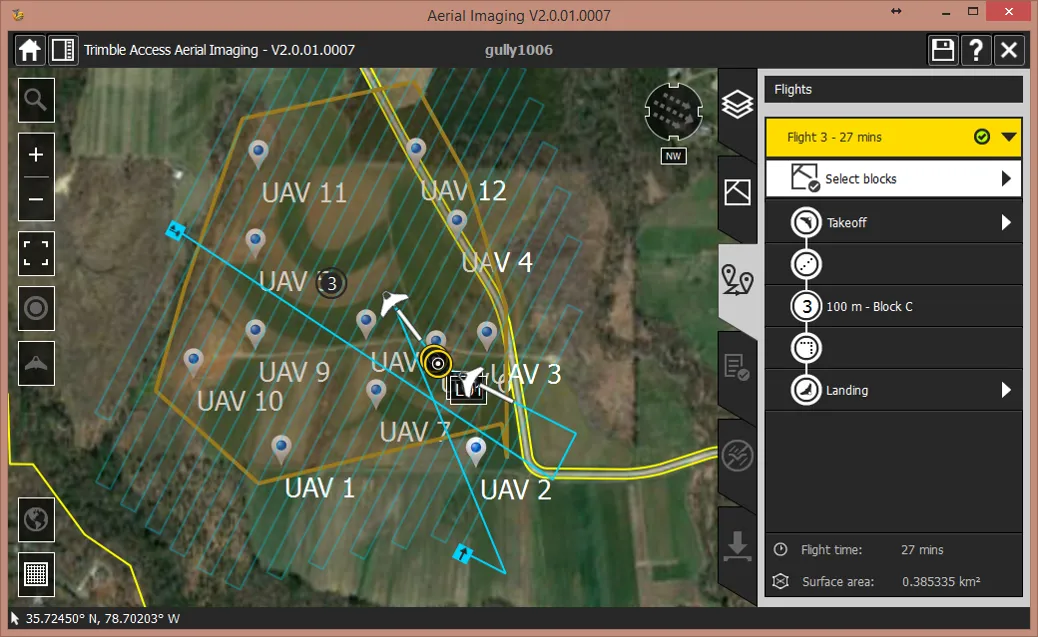
Flight plans
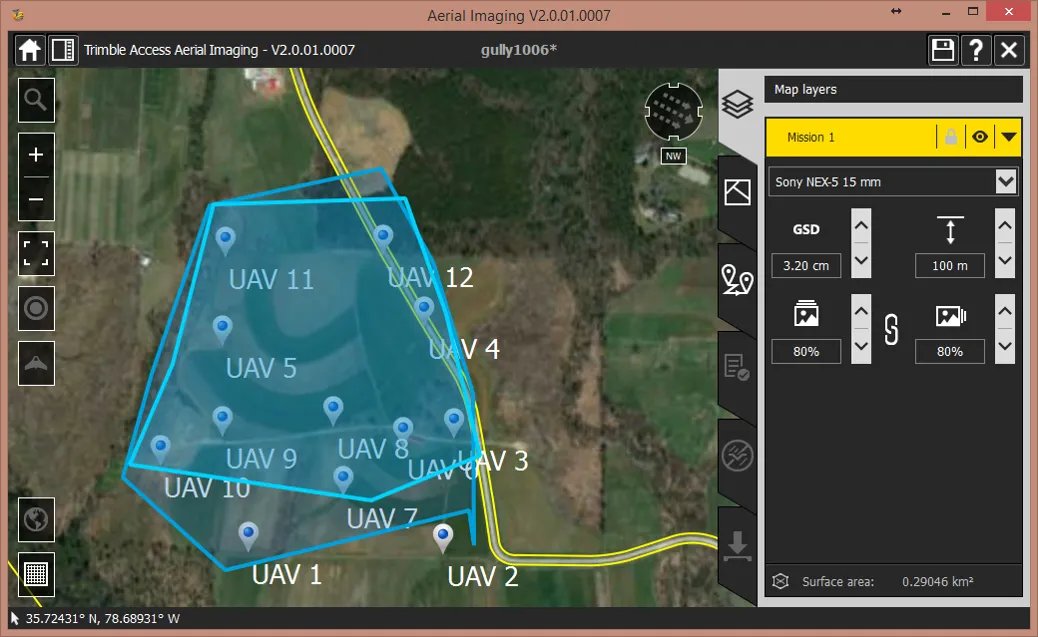
Flight plan – flight 1
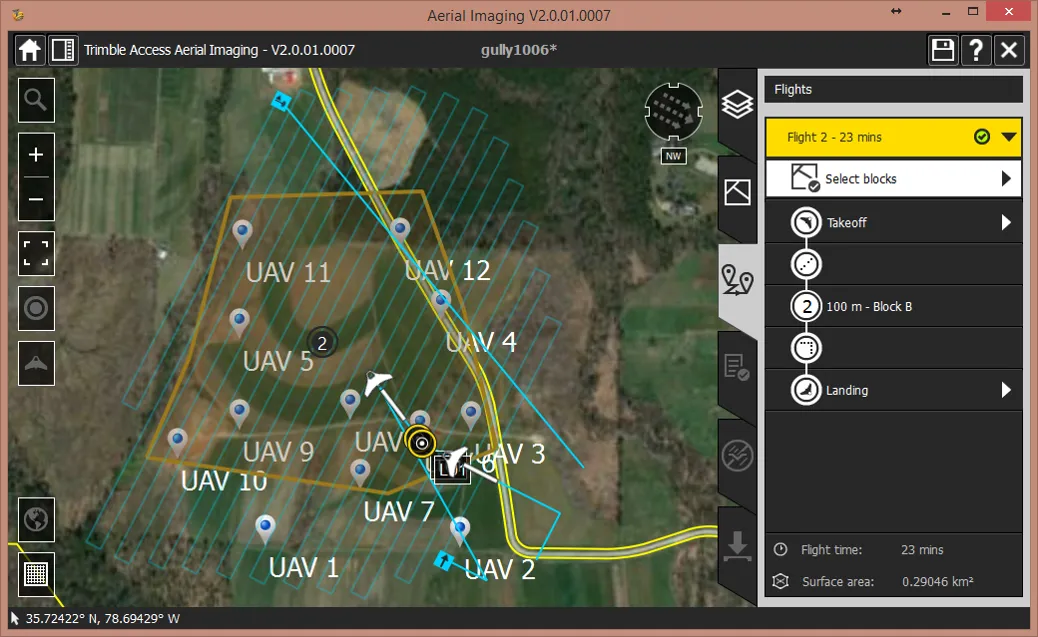
Flight plan – flight 2
Ground Control Points
Ground Control Points
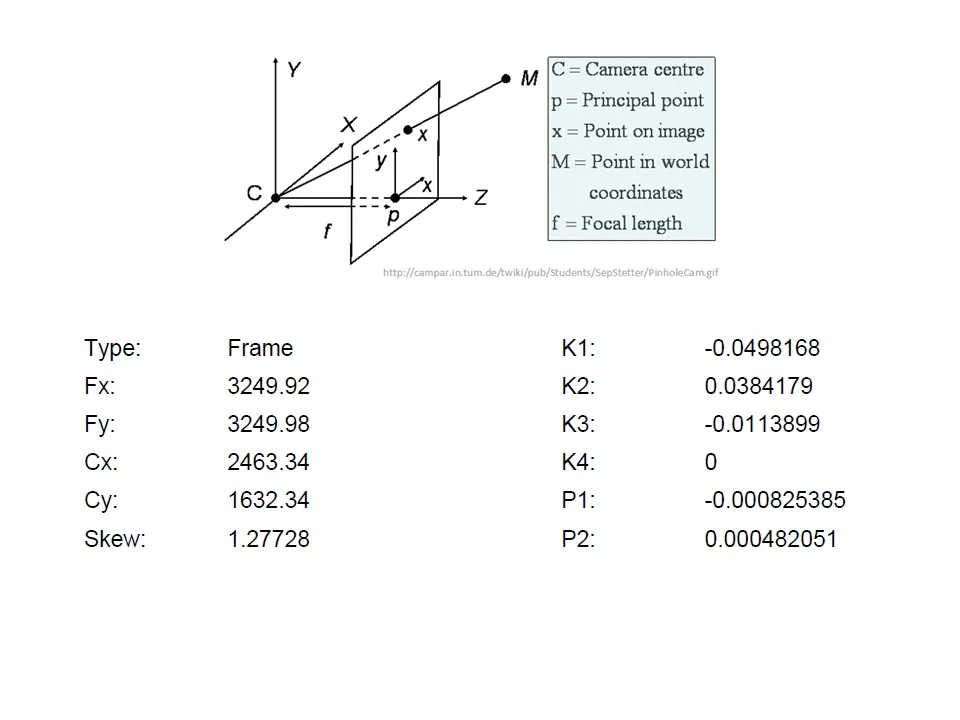
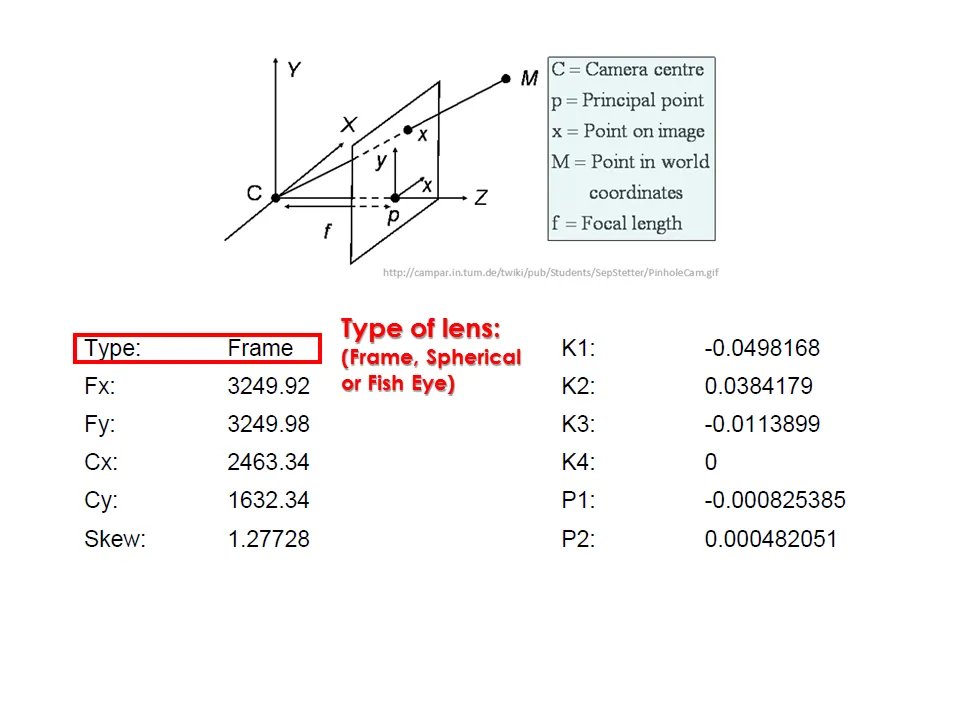
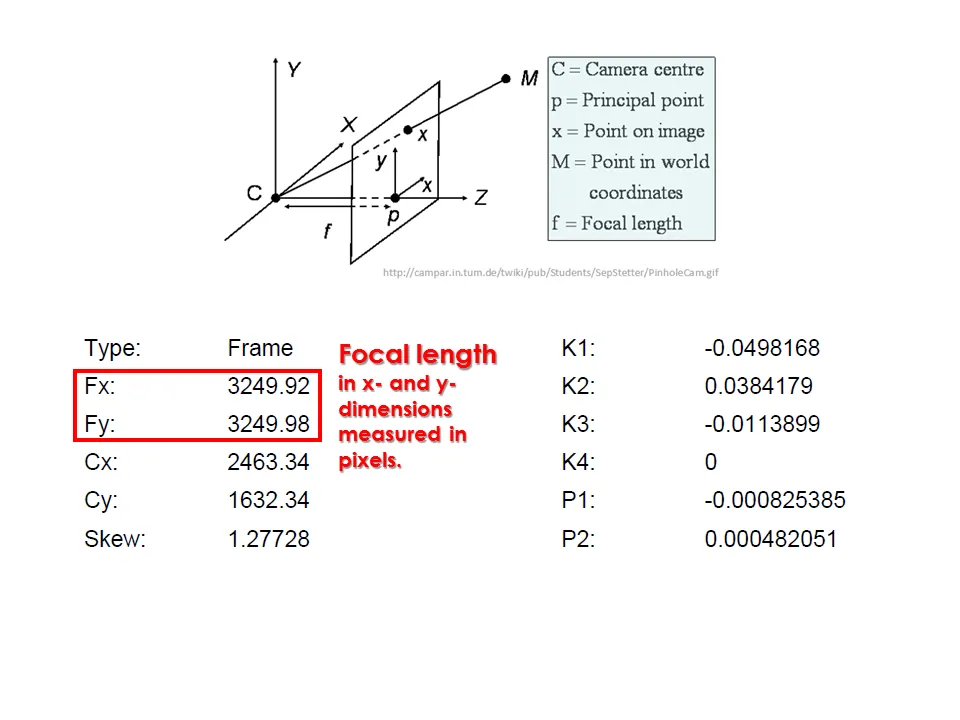
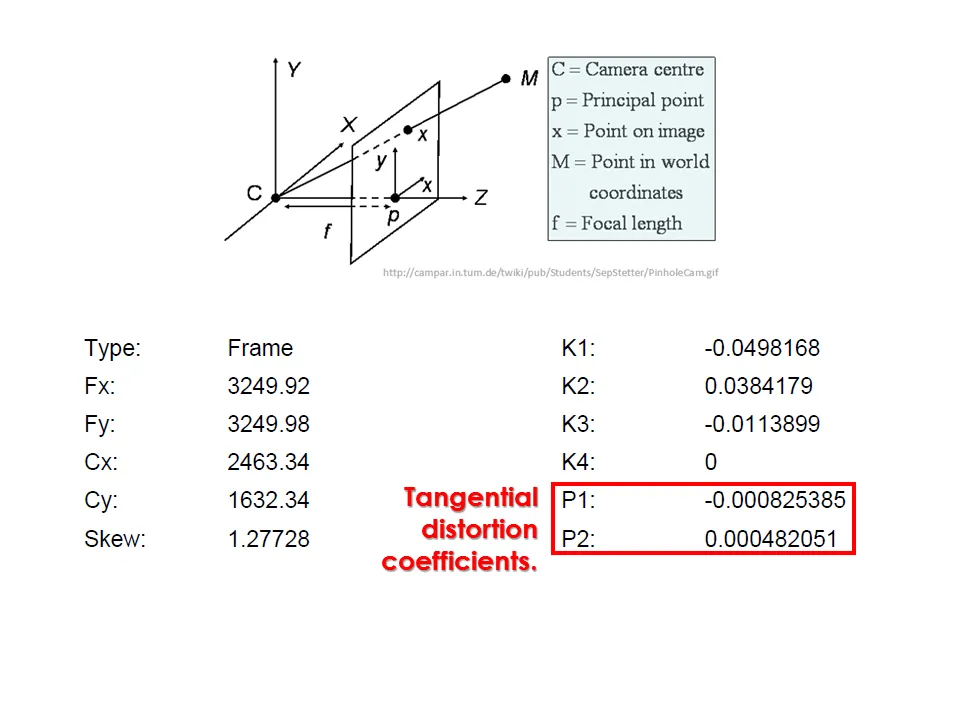
Camera calibration report
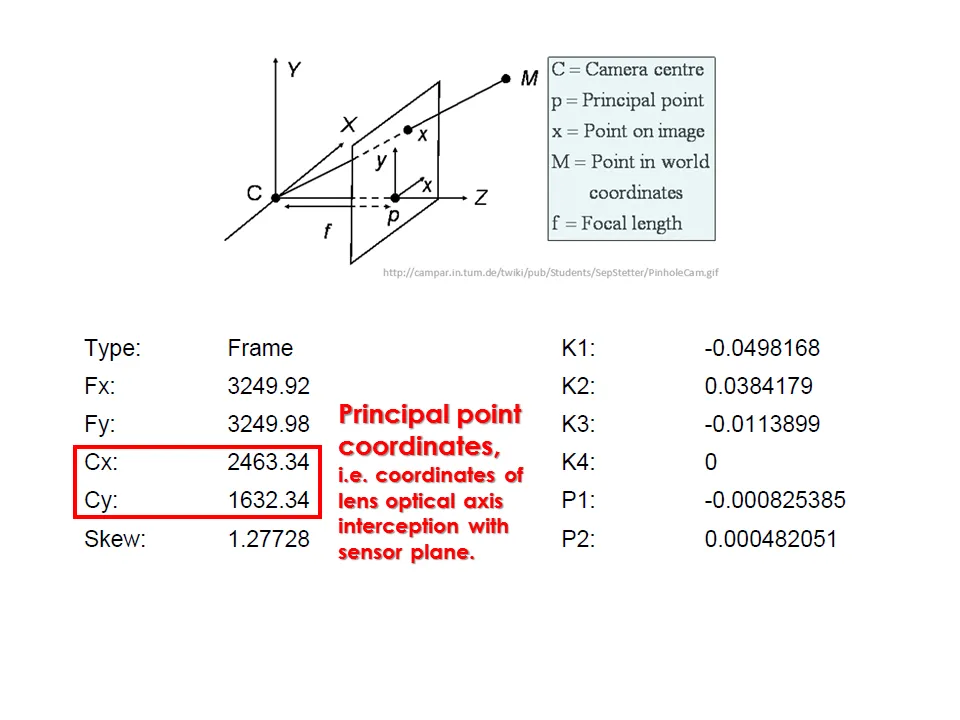
Camera calibration report
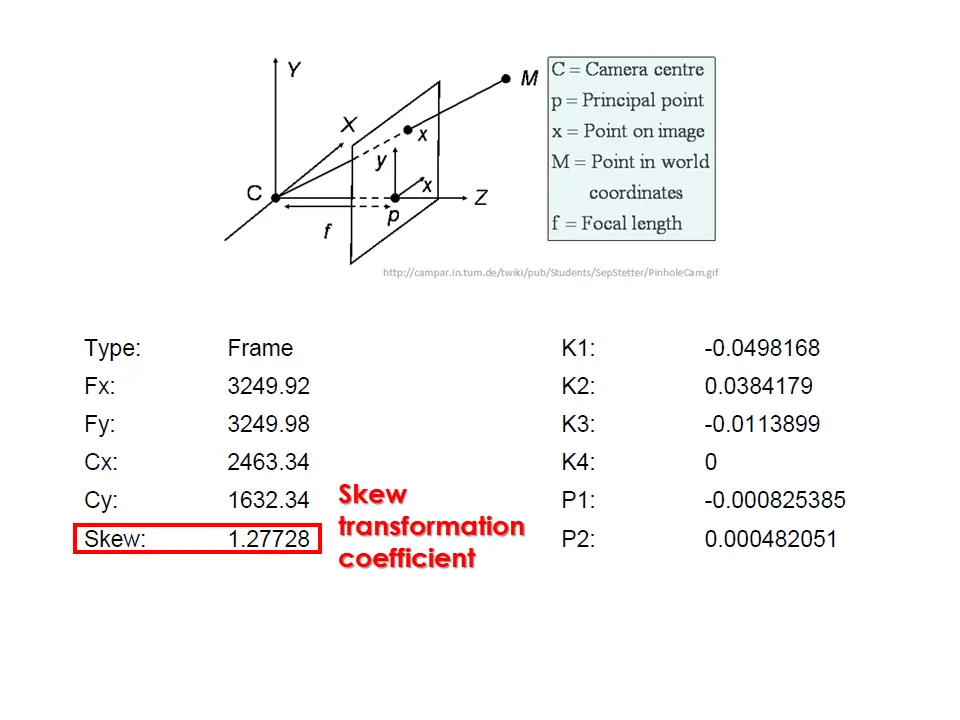
Camera calibration report
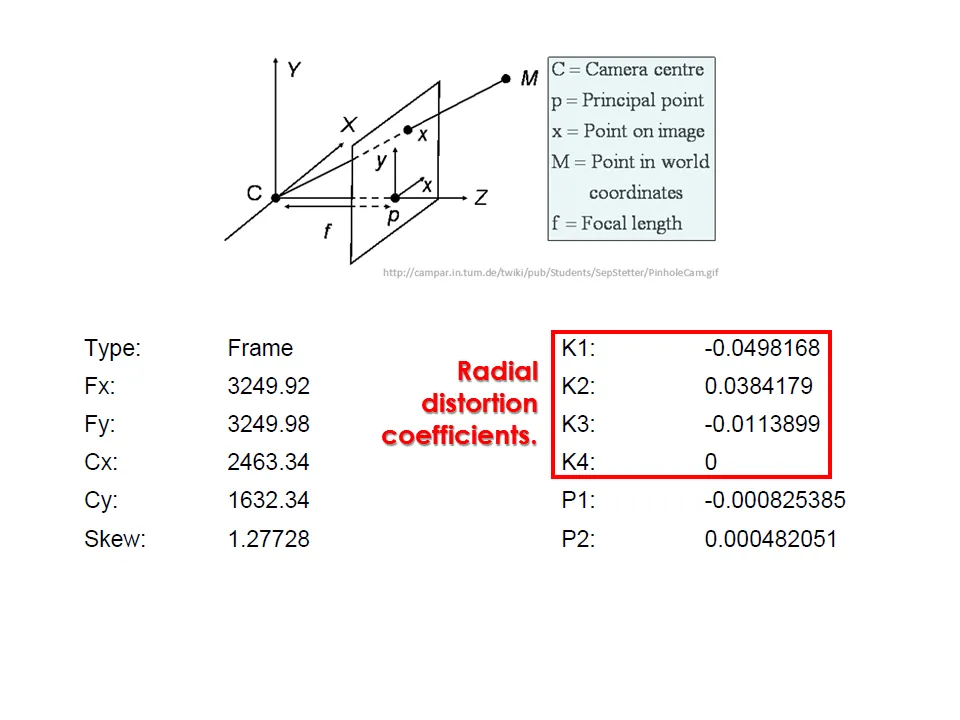
Camera calibration report
Camera calibration report
Camera calibration report
Camera calibration report
Analyzing the processing report
Includes:
While carrying out photo alignment PhotoScan estimates both internal and external camera orientation parameters, including nonlinear radial distortions.
Tools > Camera calibration
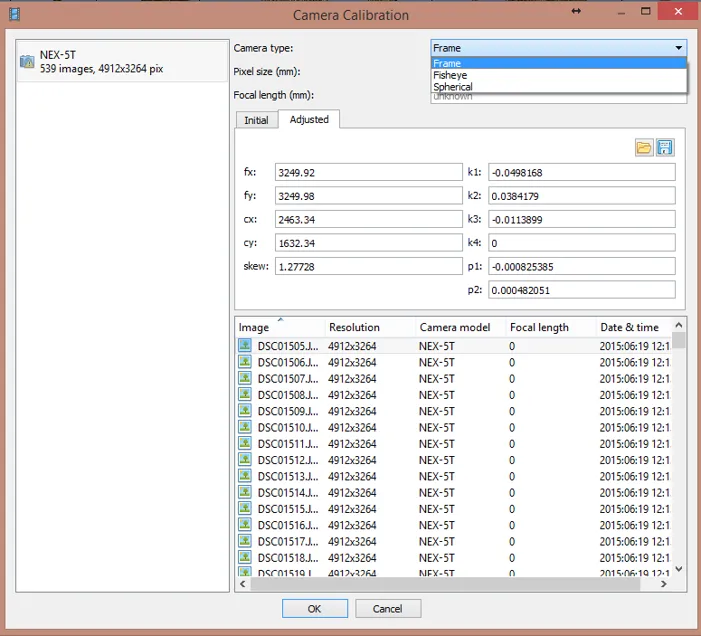
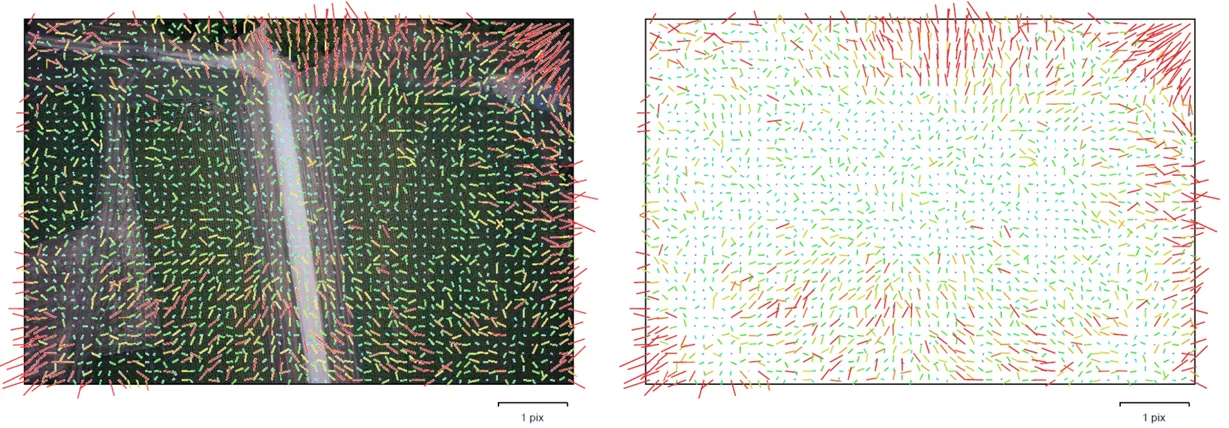
Image residuals
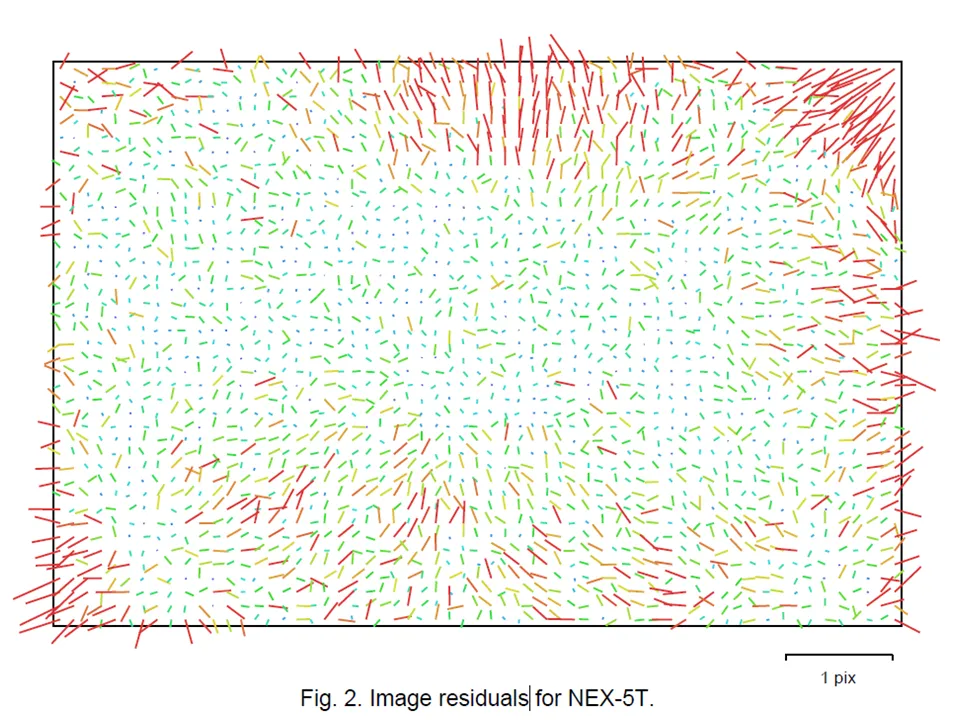
Image residuals
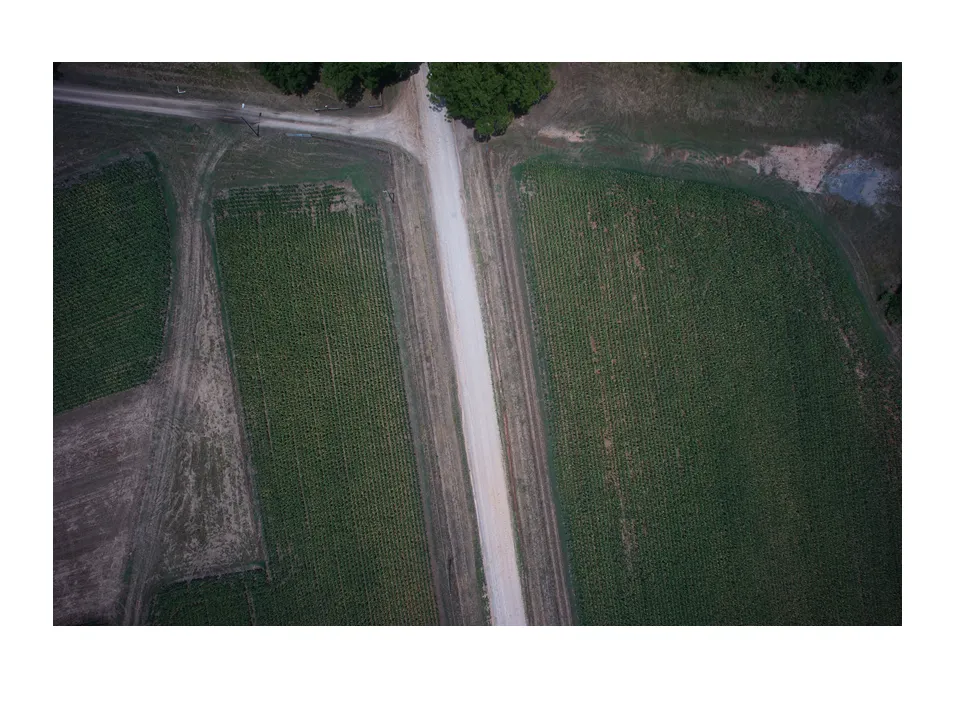
Image residuals
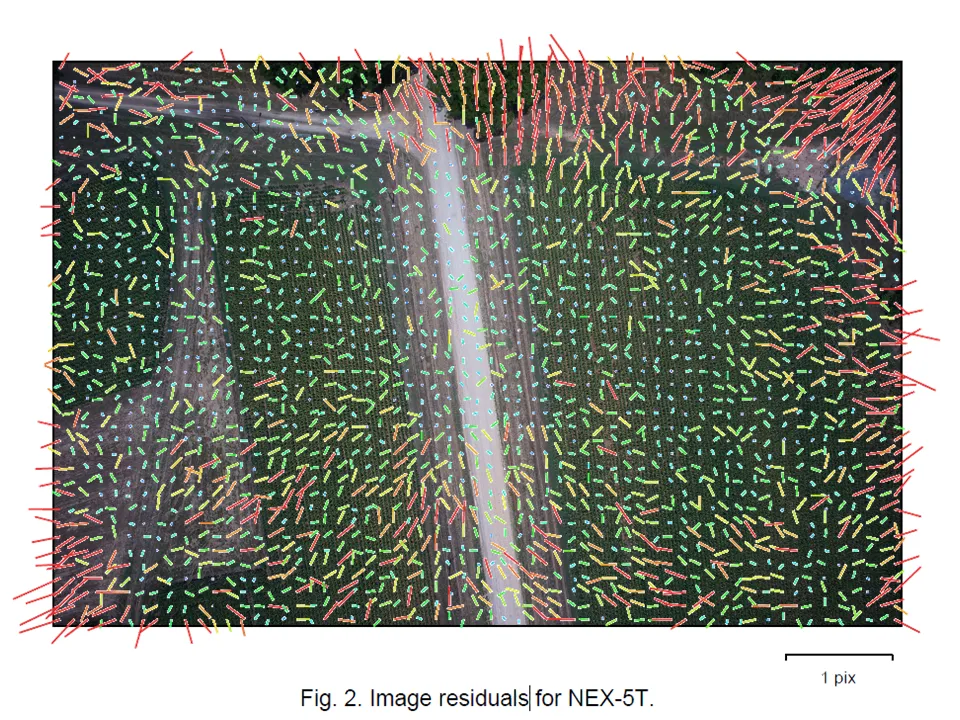
Image residuals
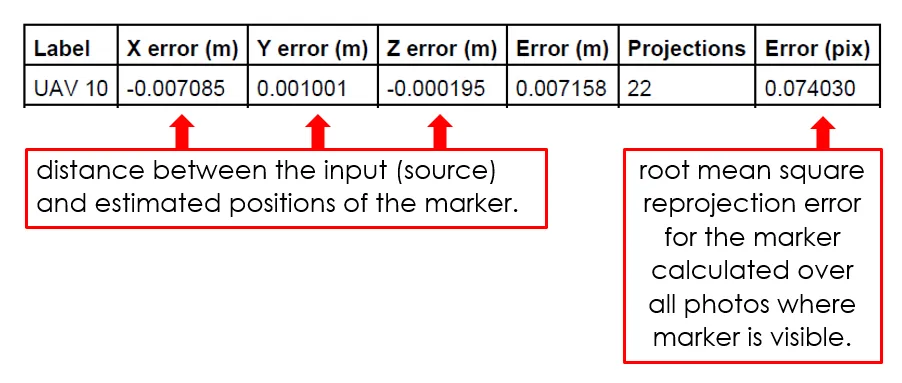
The geometric error corresponding to the average image distance, measured in pixels, between:
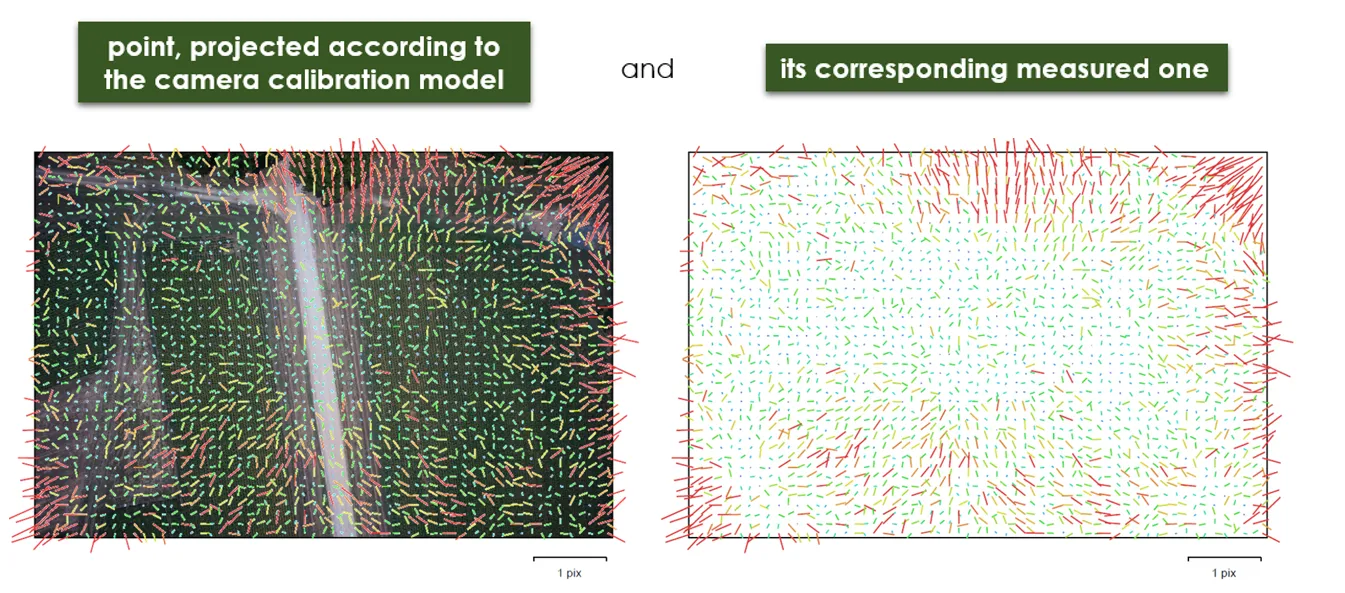
Image residuals
This reprojection error is equivalent to the root mean square (RMS) image residuals used in photogrammetric literature
Flight path
Flight path in 3D
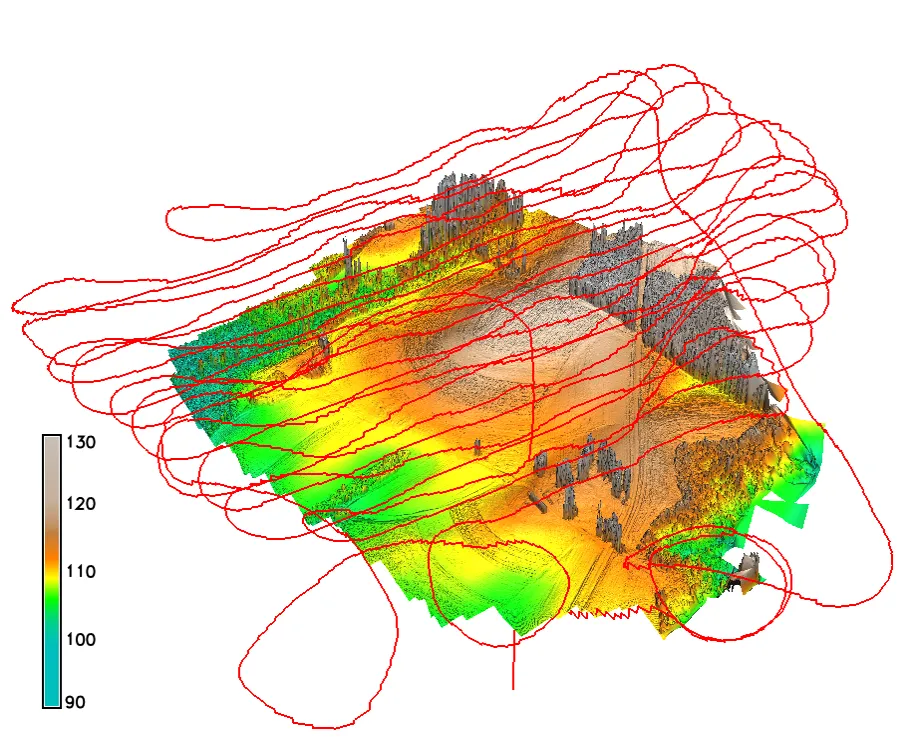
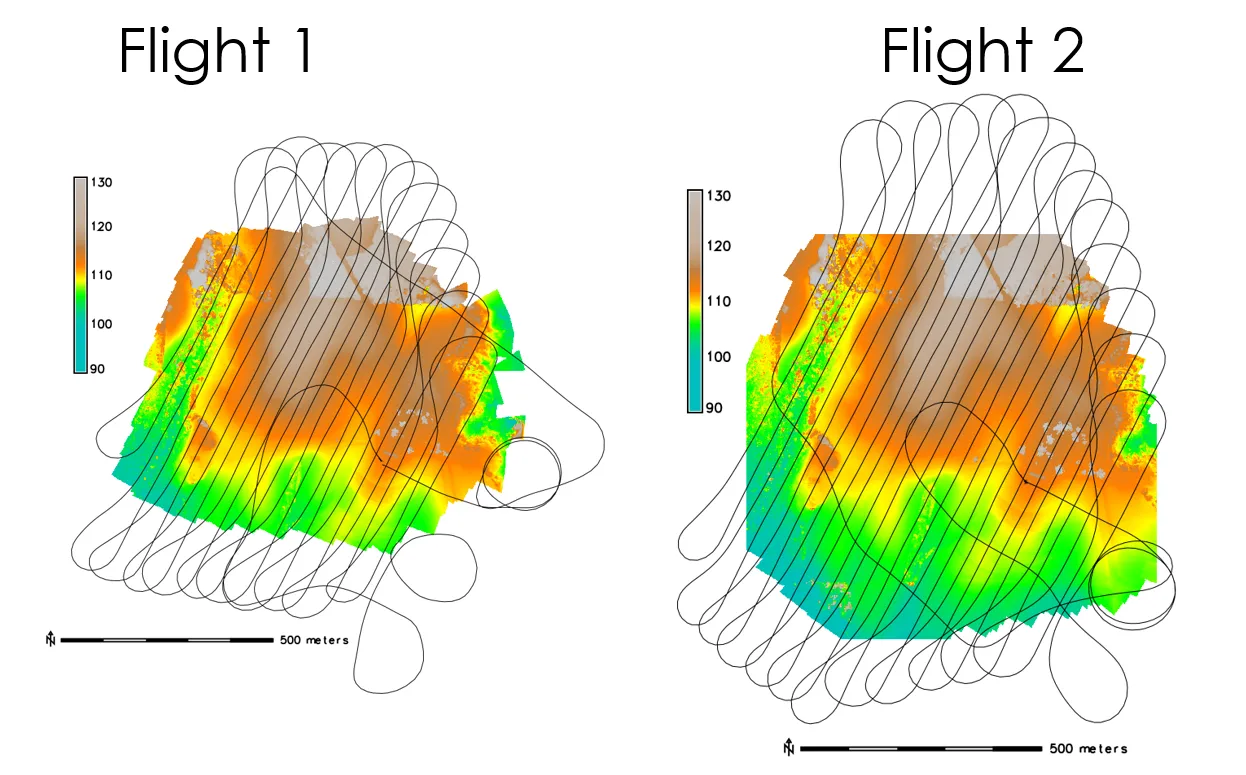
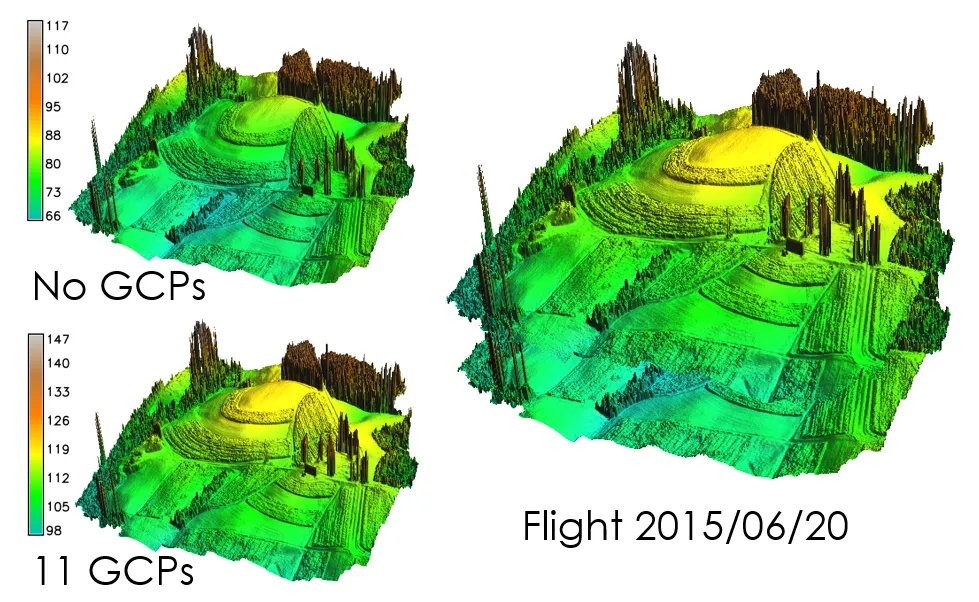
Digital Surface Model
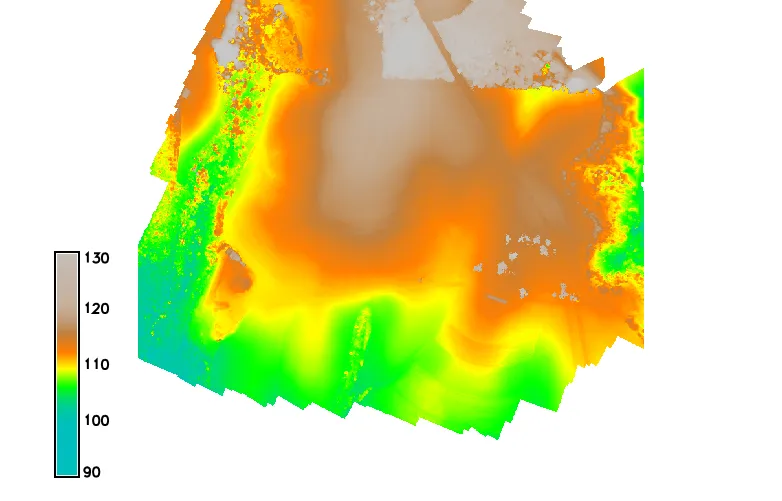
Digital Surface Model
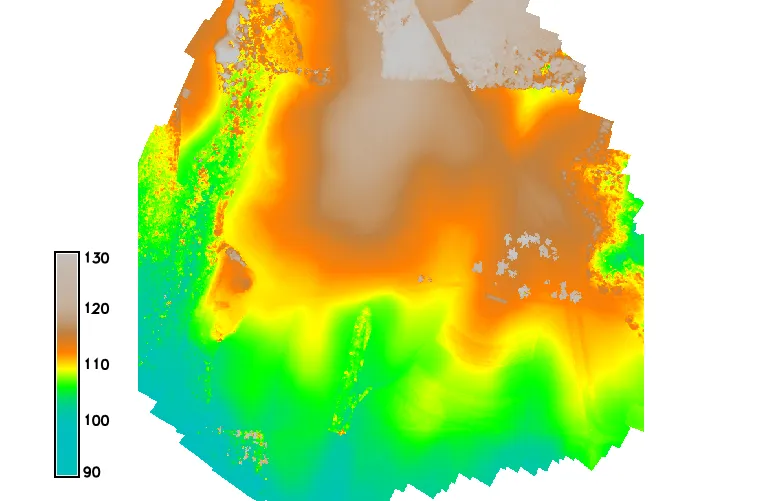
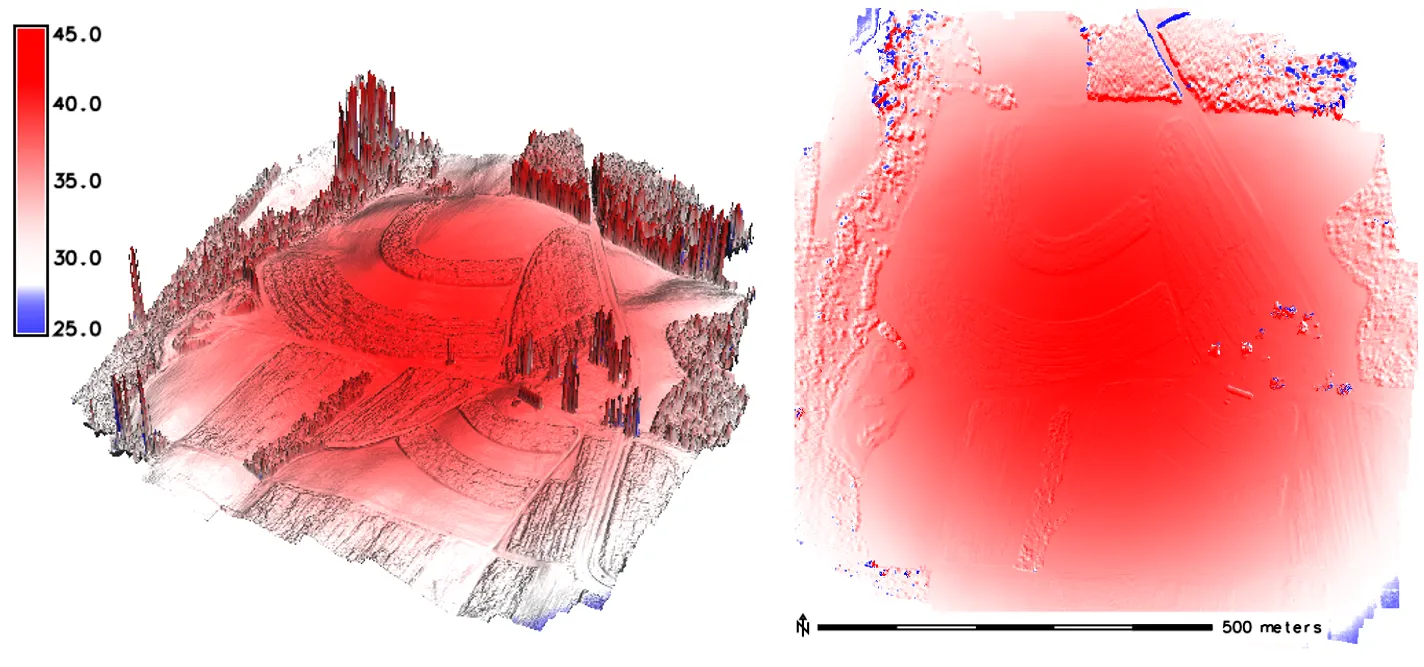
DSMs comparison
difference [m] between DSMs generated based on data from two consecutive flights
DSMs comparison by software
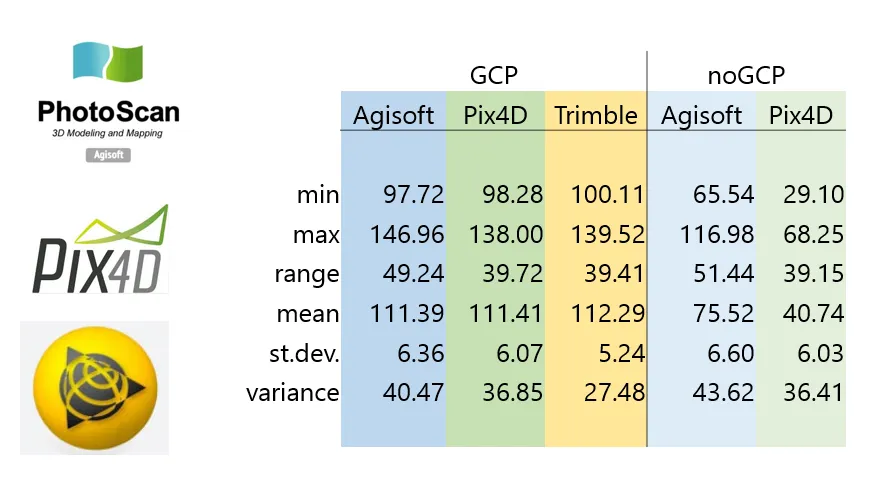
DSMs comparison -GCPs
‘Bowl effect’
effect can be introduced during photo alignment, in cases where camera calibration estimates are inaccurate
‘Bowl effect’- solutions to the problem
- Use GCPs or RTK (GPS)
- Improve Camera Calibration
- Increase flight overlaps
- Post-processing
Optimization
What is an optimization?
- PhotoScan performs full photogrammetric adjustment taking into account additional constraints introduced by ground control data
- Extrinsic and intrinsic parameters for all cameras are optimized at this step, in contrast to the simple 7-parameter transform used for georeferencing by default
- Optimization helps to significantly improve accuracy of the final solution
More on the bowl effect in this article
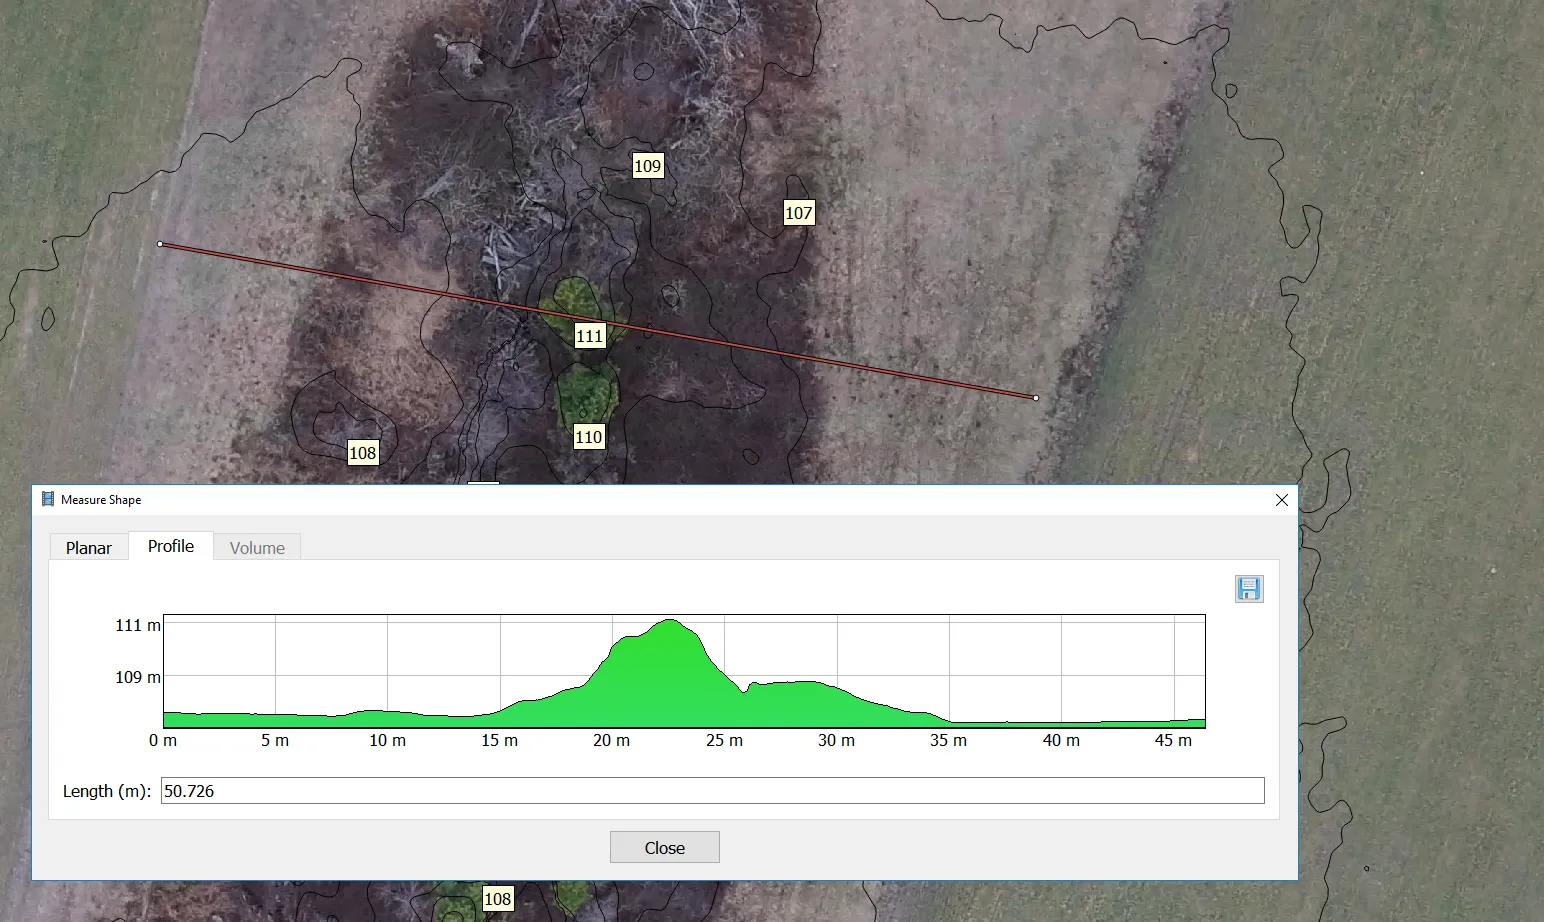
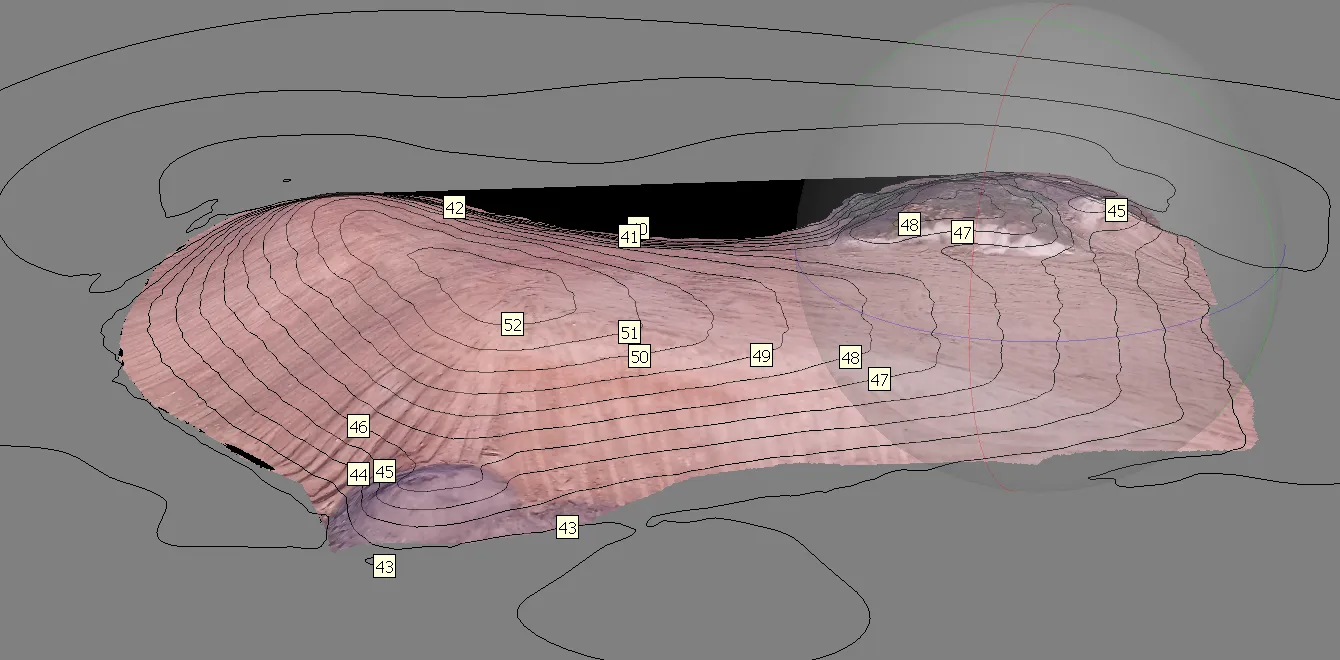
Measurements in Agisoft Photoscan
- Agisoft has capability of performing simple measurements on DSM and 3D model:
- Profile generation
Measurements in Agisoft Photoscan
- Generating contour lines
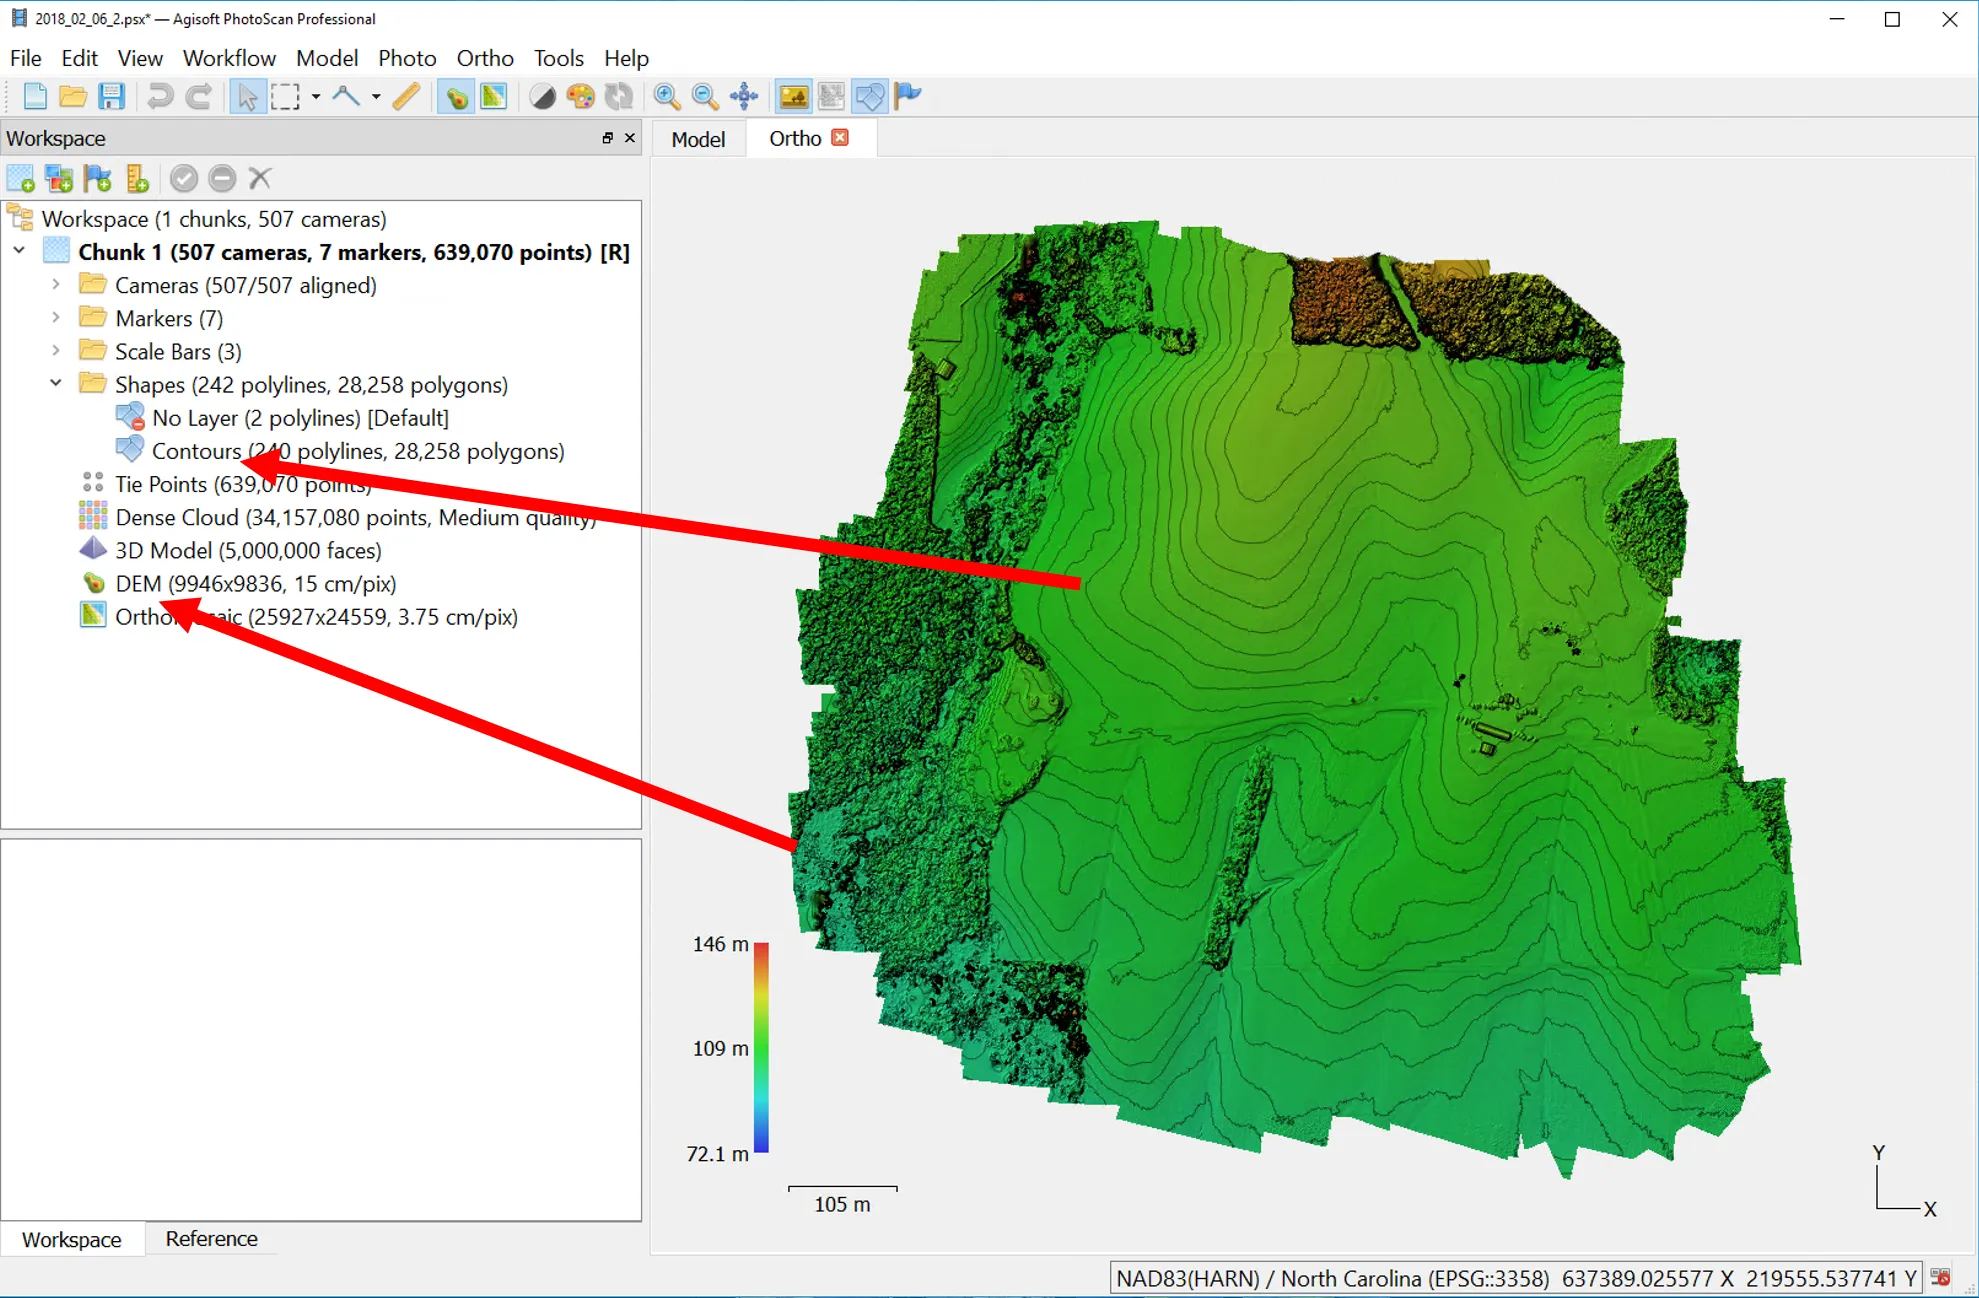
Measurements in Agisoft Photoscan
- Volume and area measurements
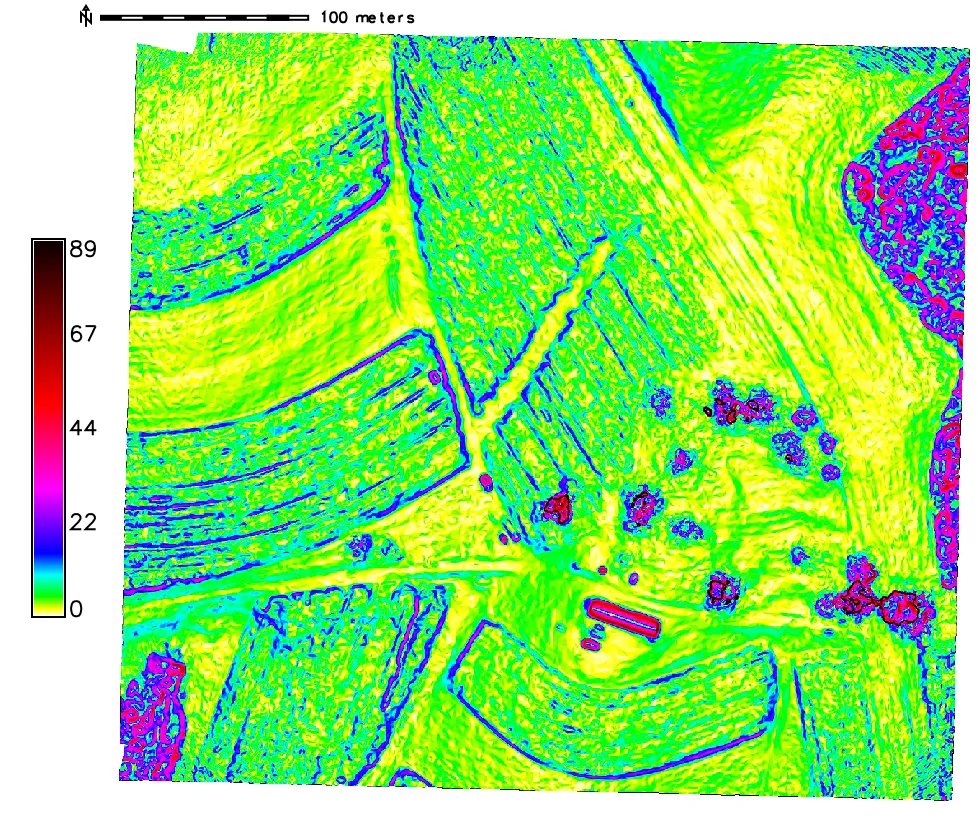
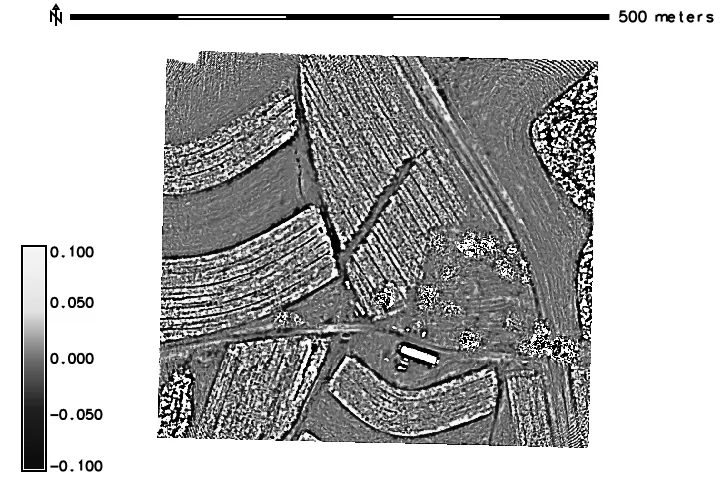
Terrain analysis in GRASS GIS
computing aspect, slope
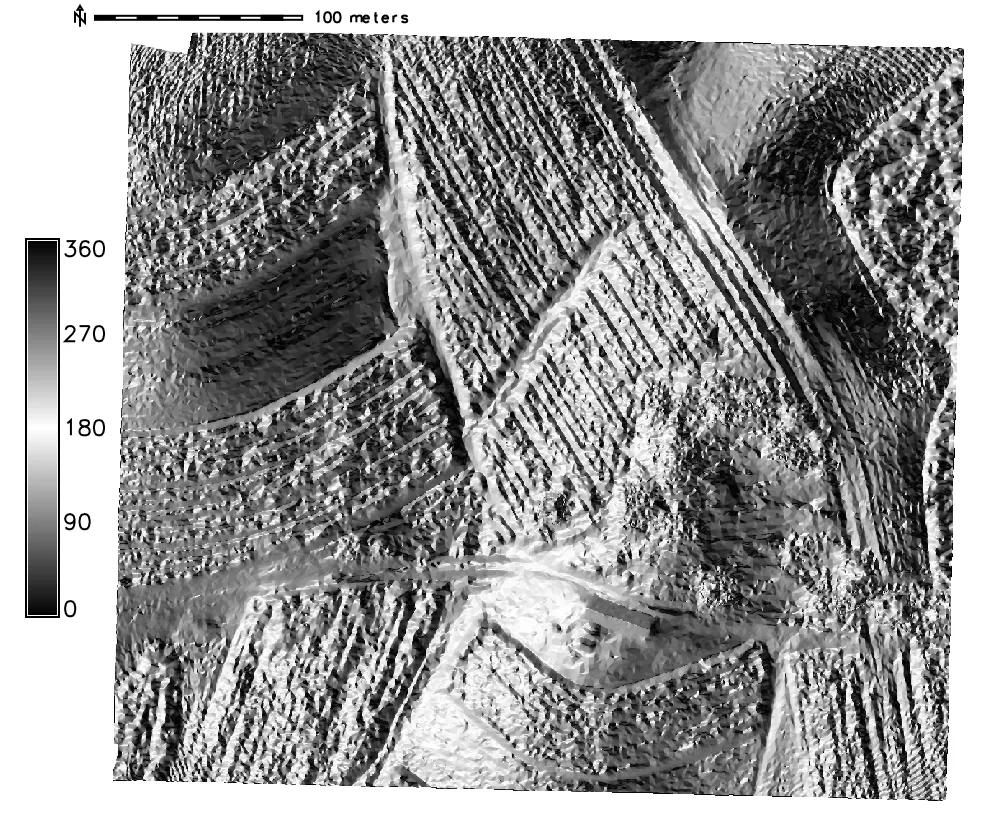
Terrain analysis in GRASS GIS
computing aspect, slope
Terrain analysis in GRASS GIS
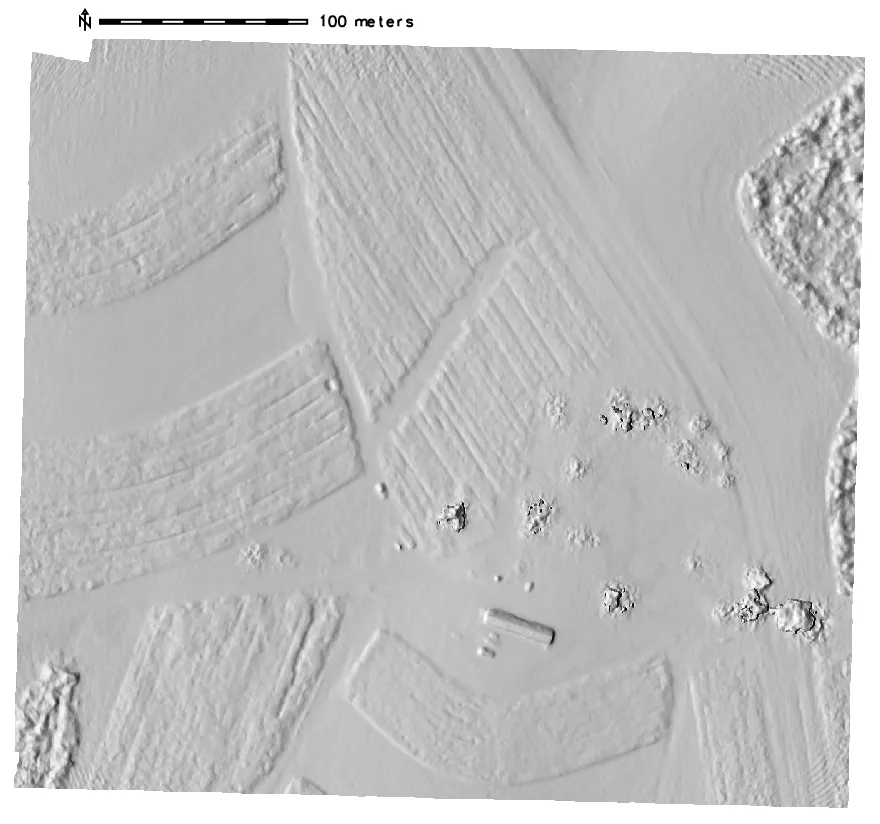
computing curvature and shaded relief maps
Terrain analysis in GRASS GIS
computing curvature and shaded relief maps
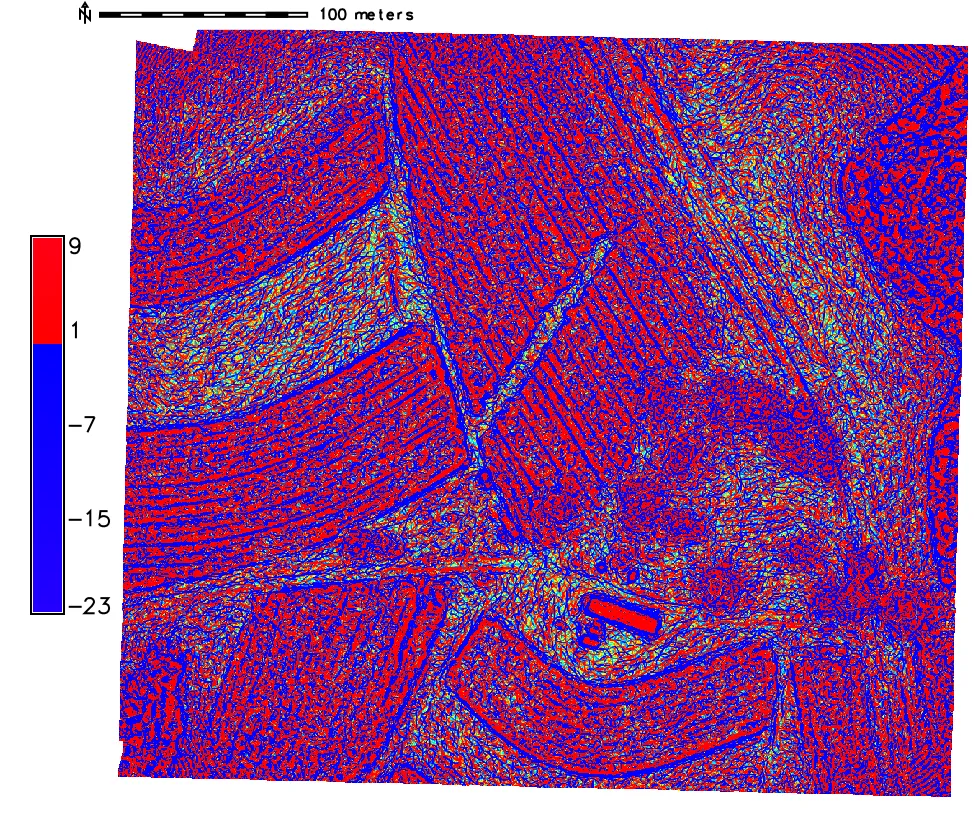
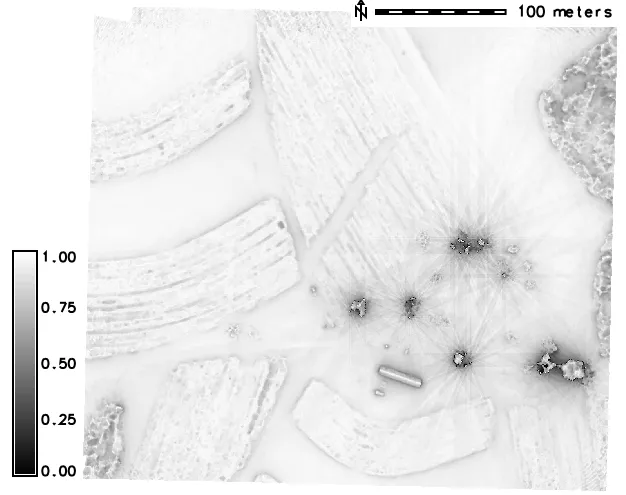
Advanced terrain analysis
computing local relief, skyview
Advanced terrain analysis
computing local relief, skyview
What did we learn?
- What are the imagery processing outputs
- How to interpret the processing results based on processing report
- How to compare results of differing processing results (by software and GCPs used)
- How use Agisoft Photoscan for simple measurements
- What GIS tools can be used for more advanced terrain analysis