Analysis of Multitemporal UAS Data and Its Applications
Center for Geospatial Analytics at North Carolina State University
Time stamps
Time stamp: the time assigned to one map in the dataset, as an instant (2015-06-20) or an interval (2015-06-01 to 2015-07-01), in absolute calendar time or in relative units such as days or years
- A UAS survey is a snapshot: an instant
- Aggregating snapshots over months or seasons turns them into intervals
- The dataset’s temporal type, absolute or relative, is set when it is created

The registered series
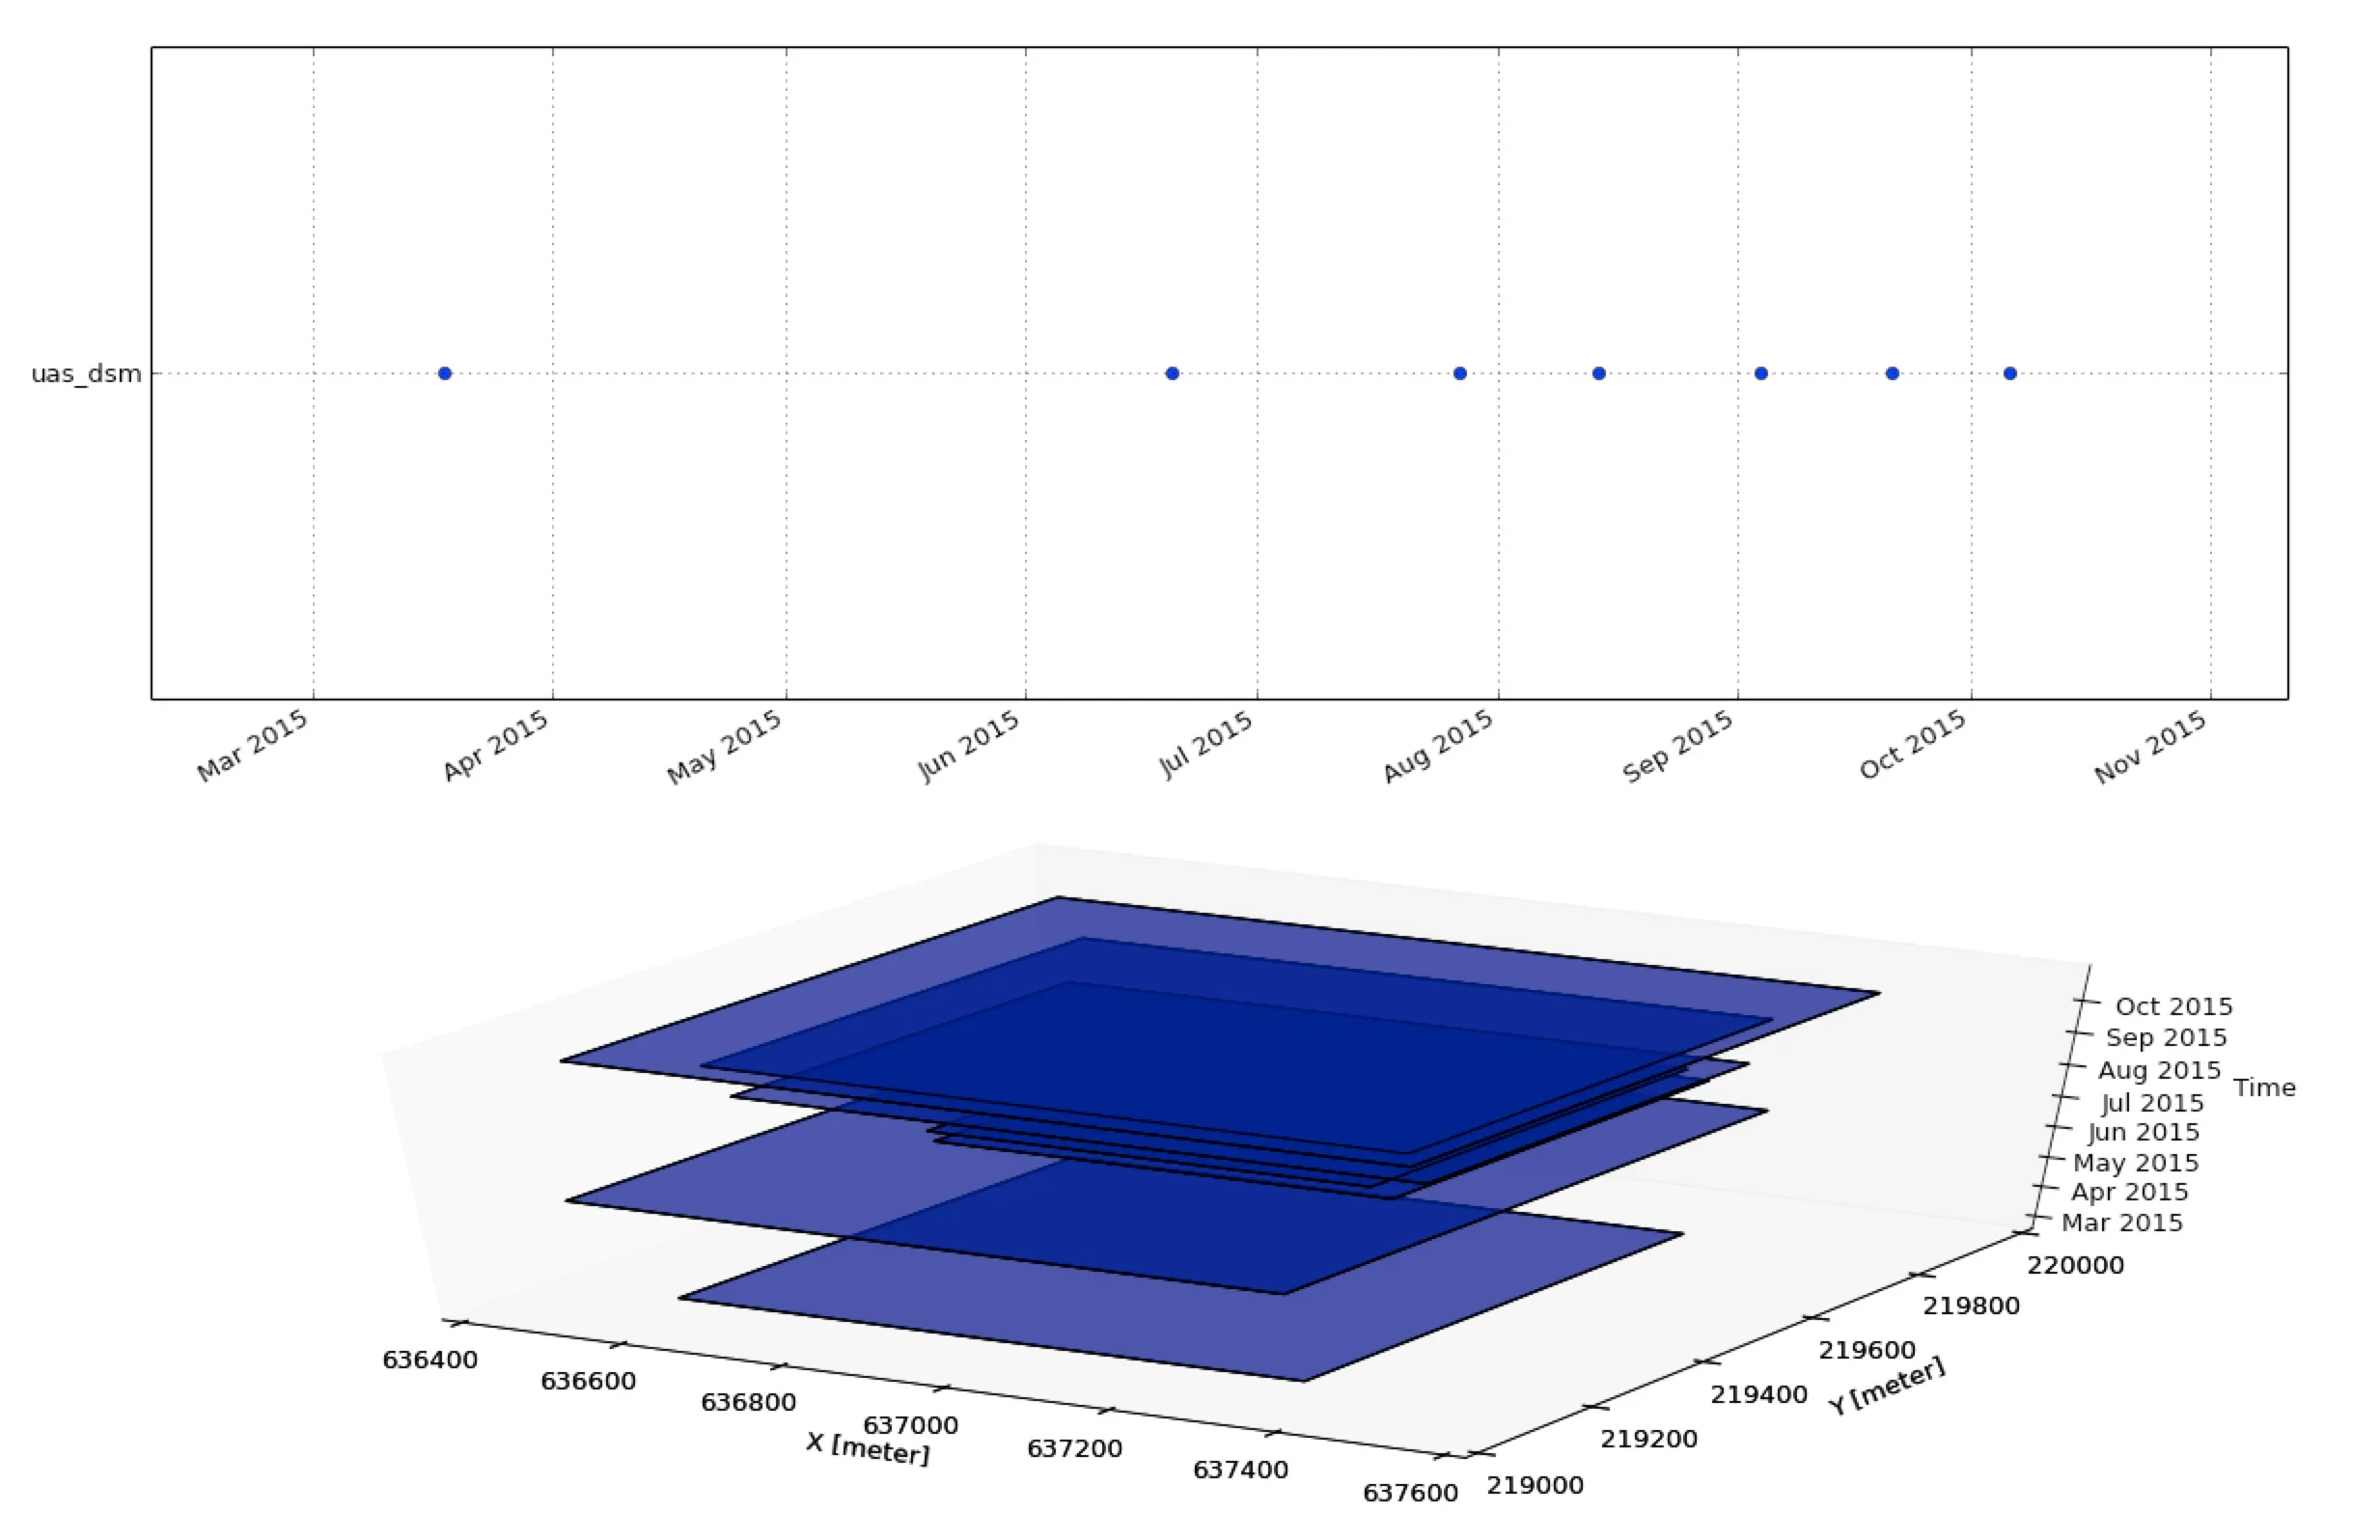
- The Timeline Tool shows when each map was taken and, in 3D, its spatial extent
t.rast.listlists the maps with their times and statistics, optionally filtered with awhereclause
Temporal plot
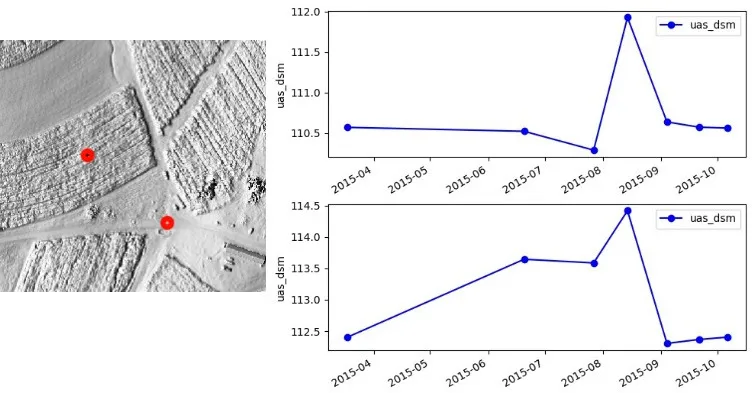
The Temporal Plot Tool plots the value of every map in the series at one location
Count and intersection
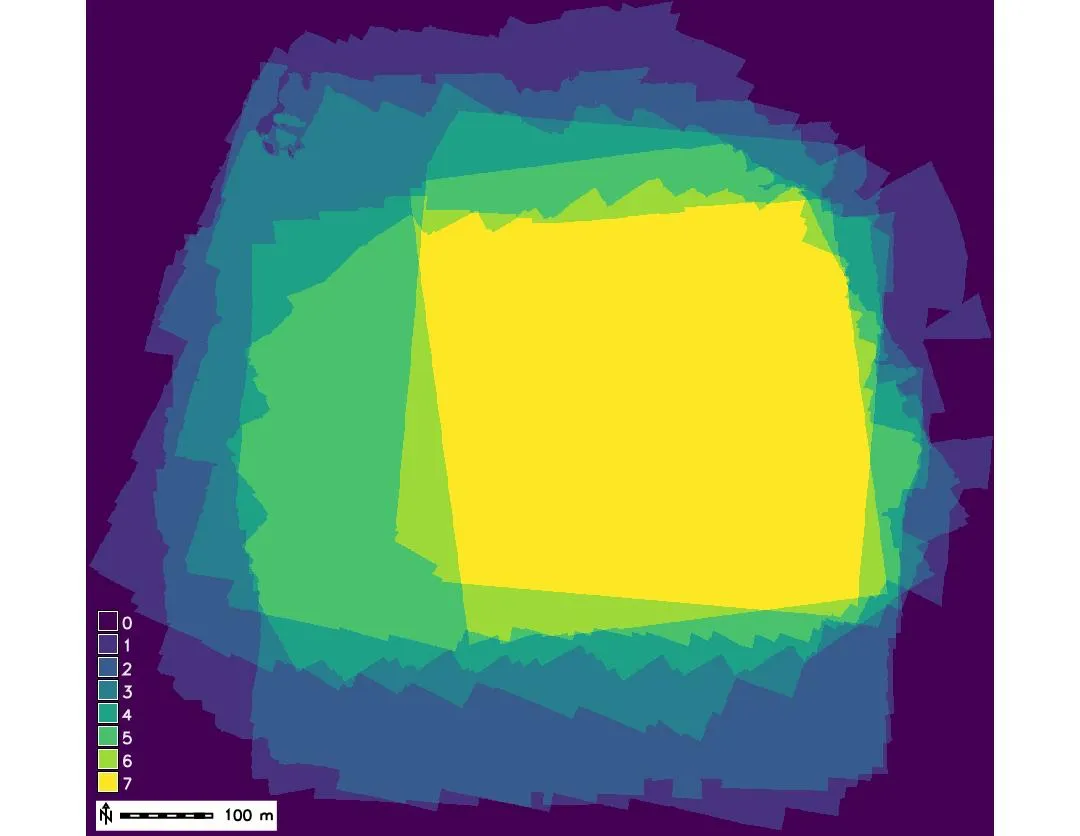
Count: maps with a value in each cell
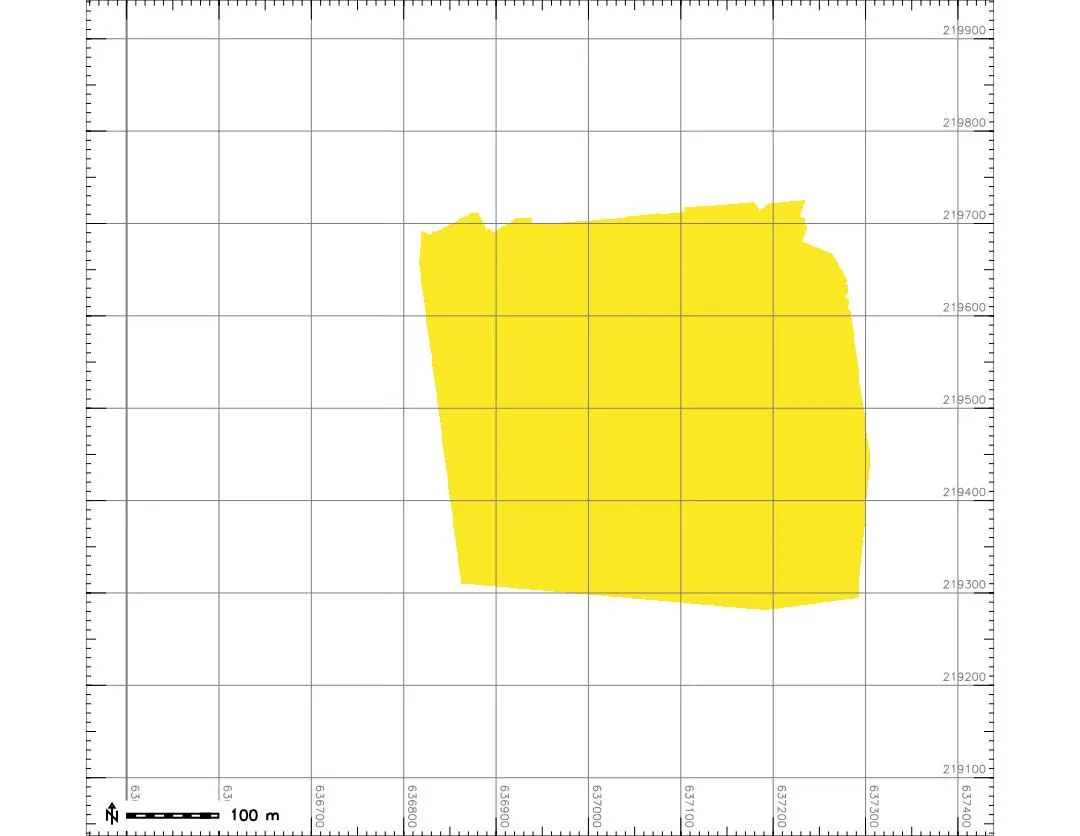
Intersection: cells covered by every map
In GRASS: t.rast.series input=uas_dsm method=count output=count, and with -n the count is null where any map is null, which is the intersection
Temporal aggregation
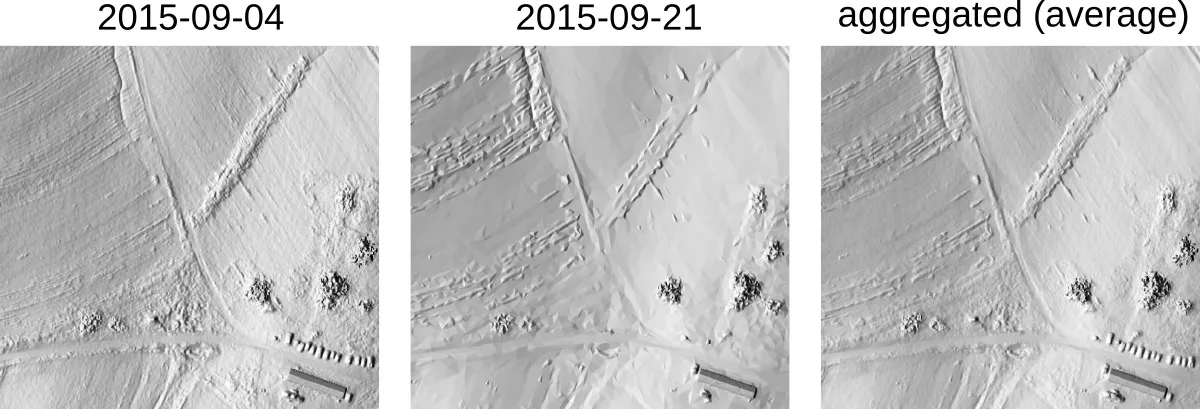
Temporal aggregation: combining the maps that fall in each interval of a chosen granularity into one map with a statistic, such as the monthly mean; t.rast.aggregate
Core and envelope
Core surface: the minimum elevation measured at each cell over the series. Envelope: the maximum. Everything the surface ever did lies between them
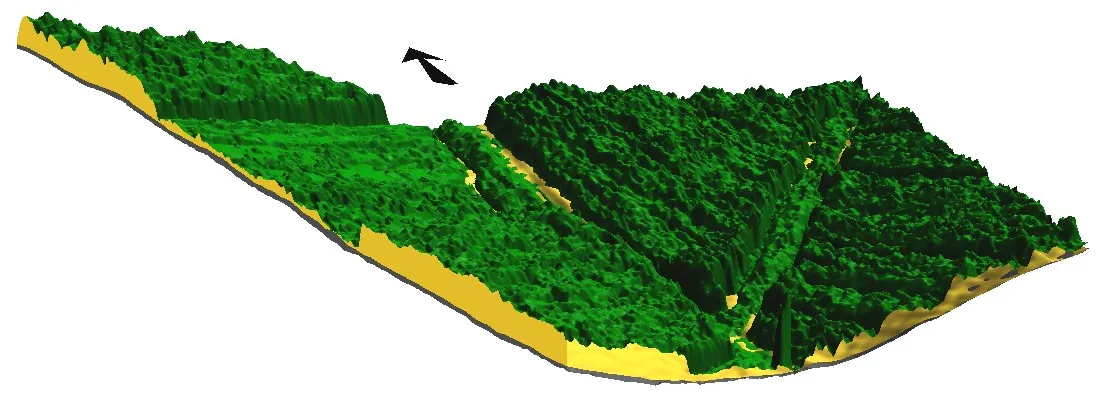
Cutting planes through the lidar ground, the core, and the envelope of the series
Finding distorted surveys
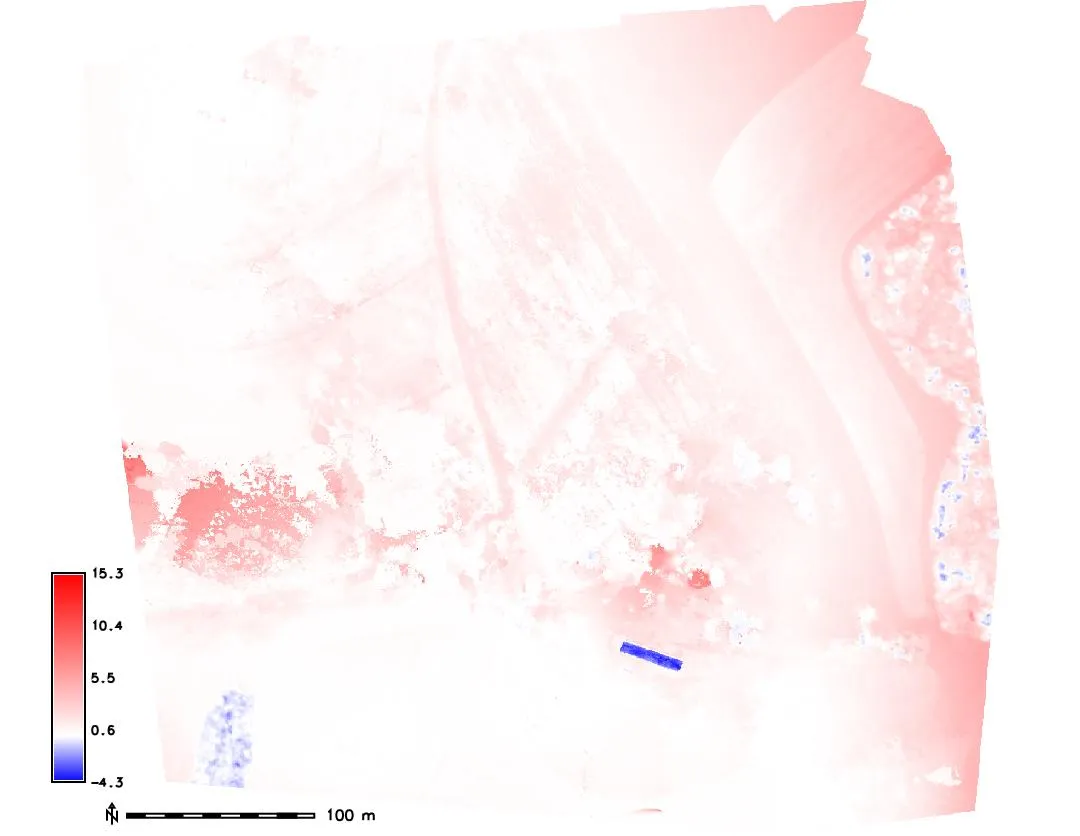
Lidar ground minus core
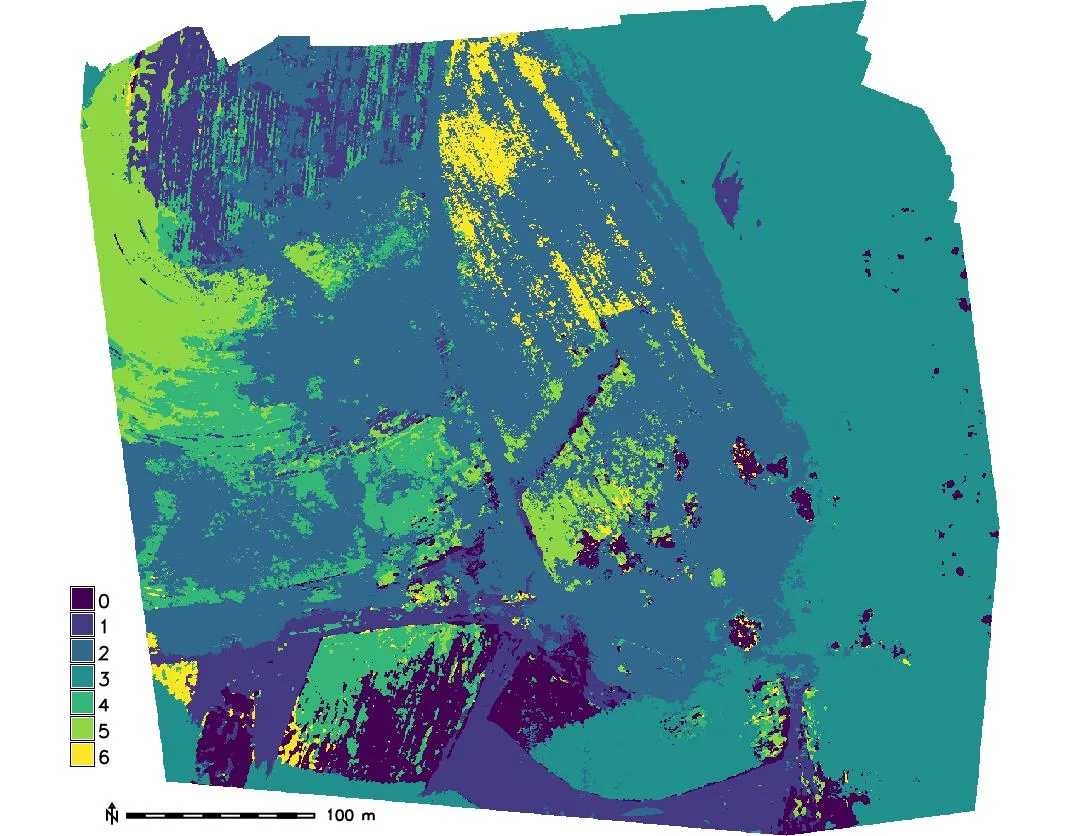
Index of the map with the minimum
- Compute the core and subtract it from the lidar bare ground
- Where the core lies well below the ground,
min_rasternames the survey responsible
Corrected core surface
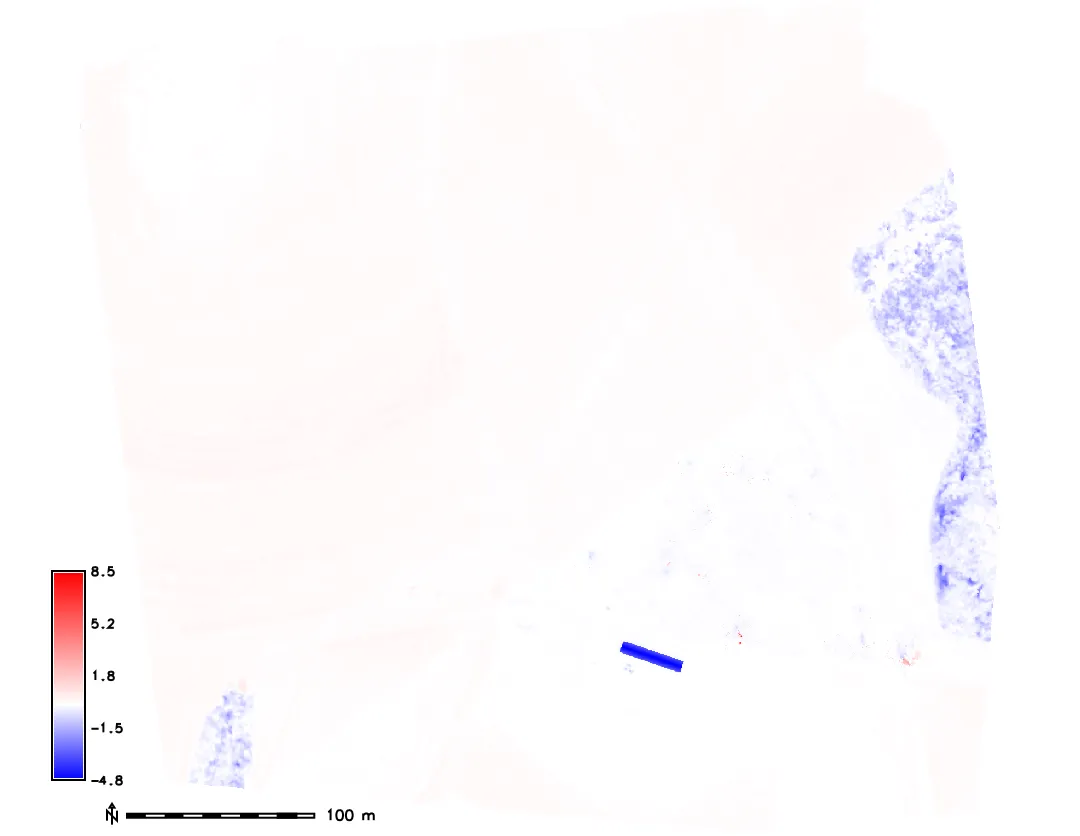
Without the two distorted surveys
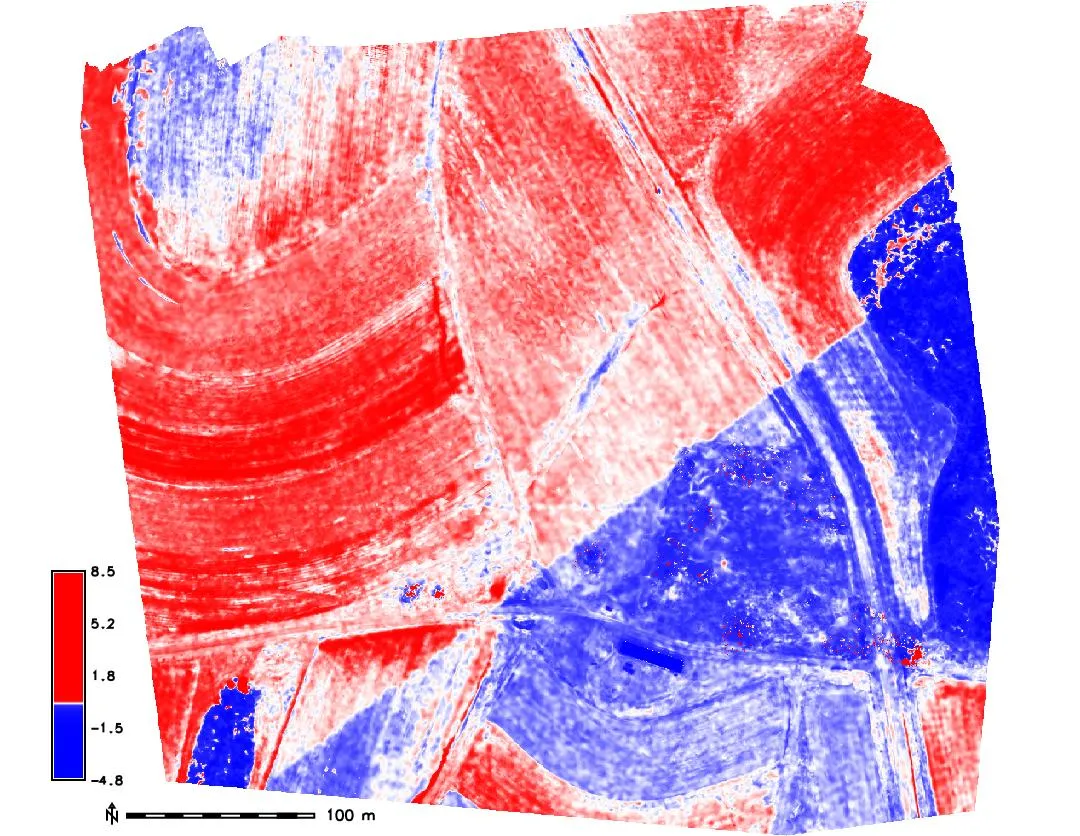
Histogram-equalized colors
- Remove the distorted DSMs and recompute the core: the difference to the lidar ground is now small
- A histogram-equalized color table stretches the small differences and reveals a shift between two lidar swaths
Envelope and range
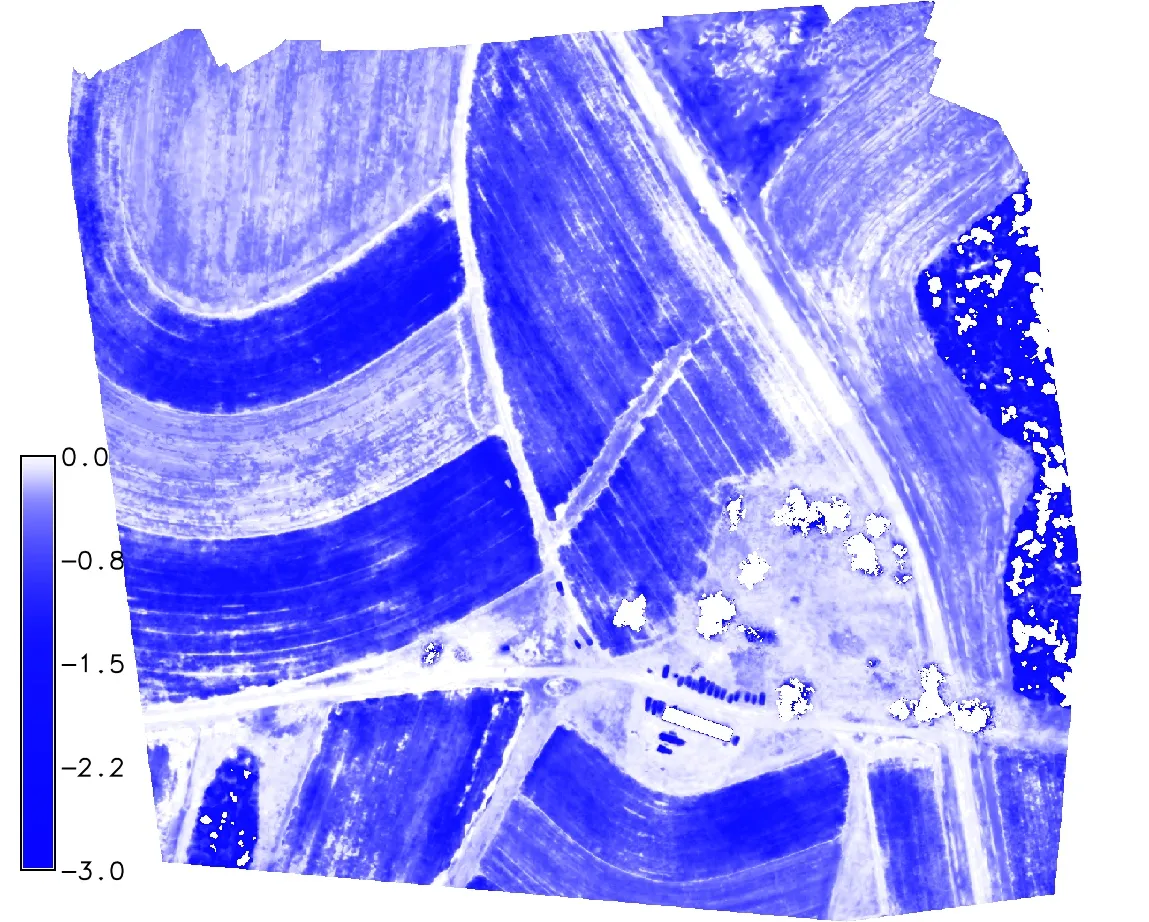
Lidar ground minus envelope: the tallest crop at each cell
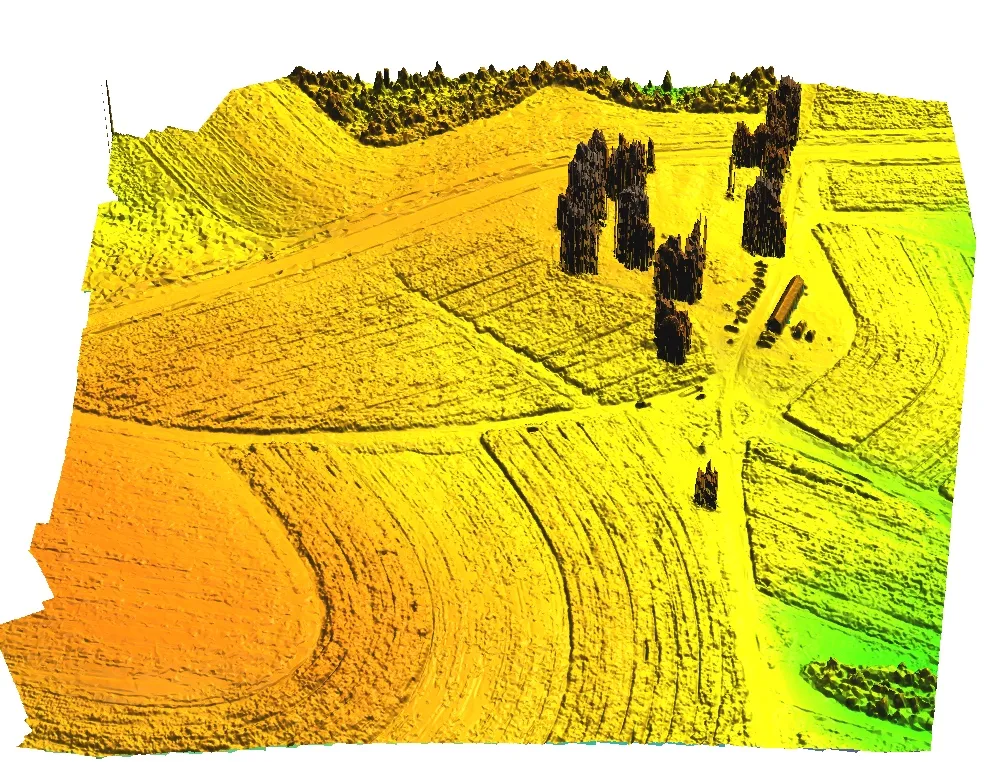
The envelope surface in 3D
- Envelope minus ground: the maximum crop height over the season at each cell
- Time of maximum: when each cell was highest
- Range: where the surface varied most
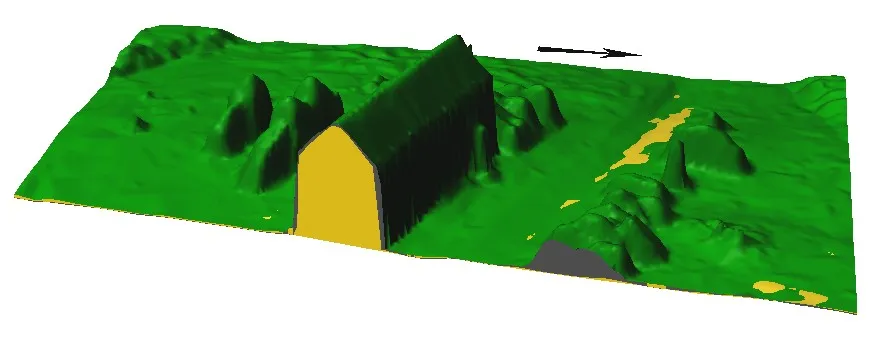
Envelope of a parking area
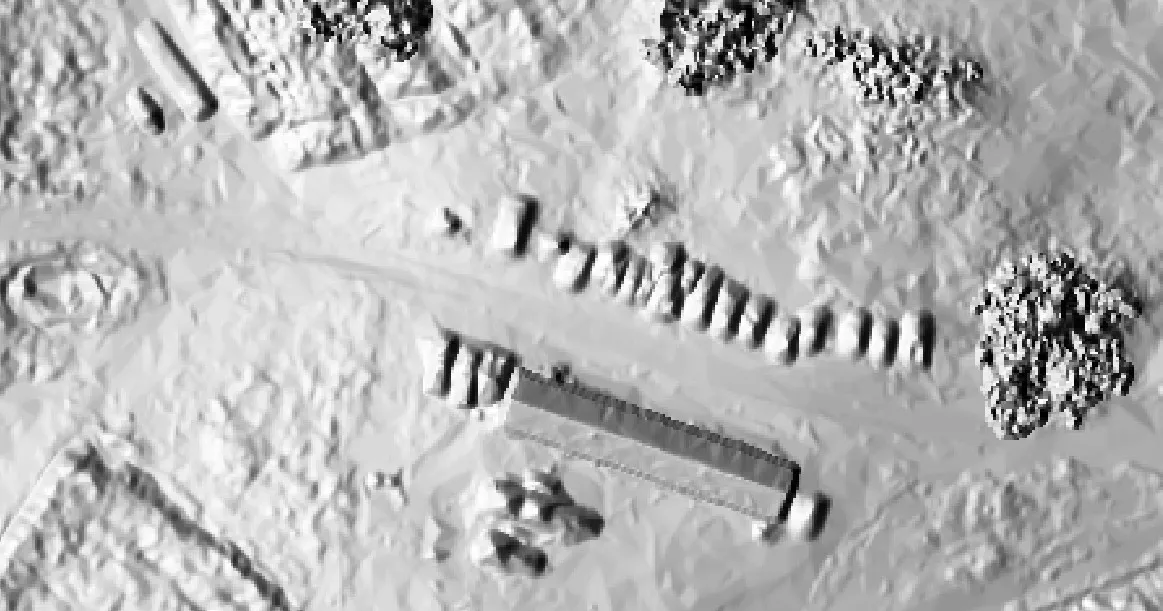
- The envelope shows every car that was parked at the site during any flight
- Core, snapshot, and envelope surfaces together describe how an area is used
Crop height series
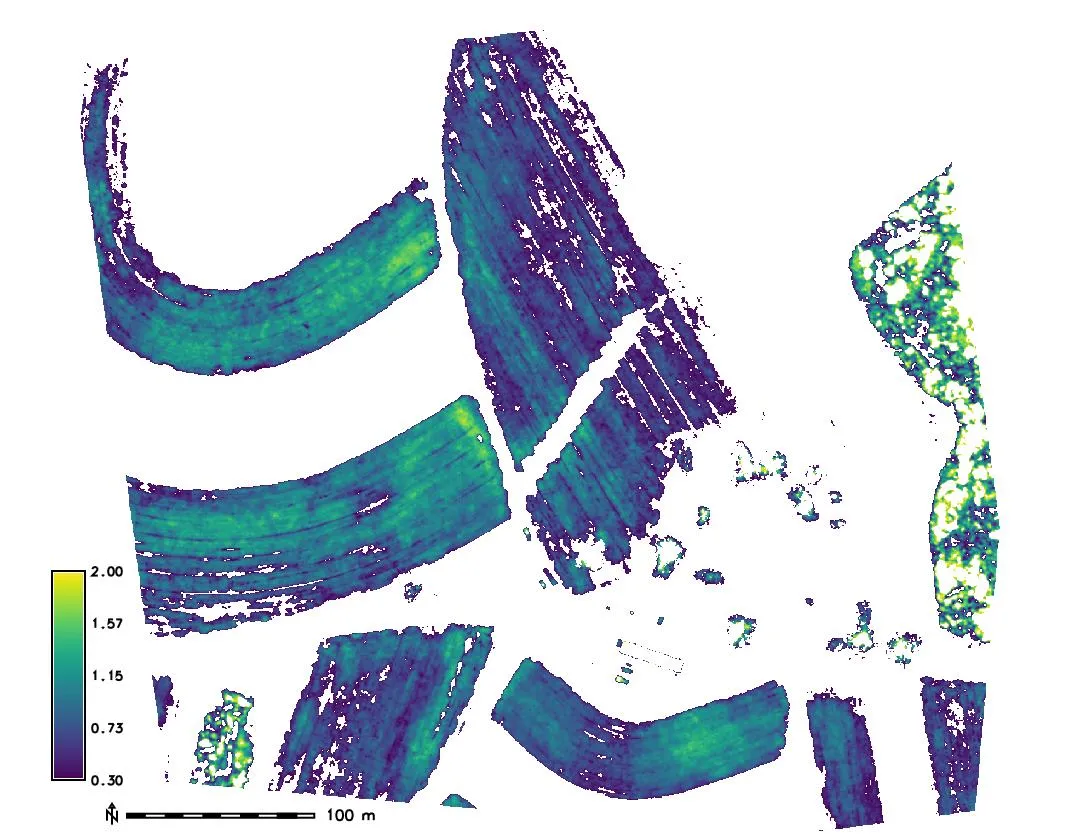
June 20
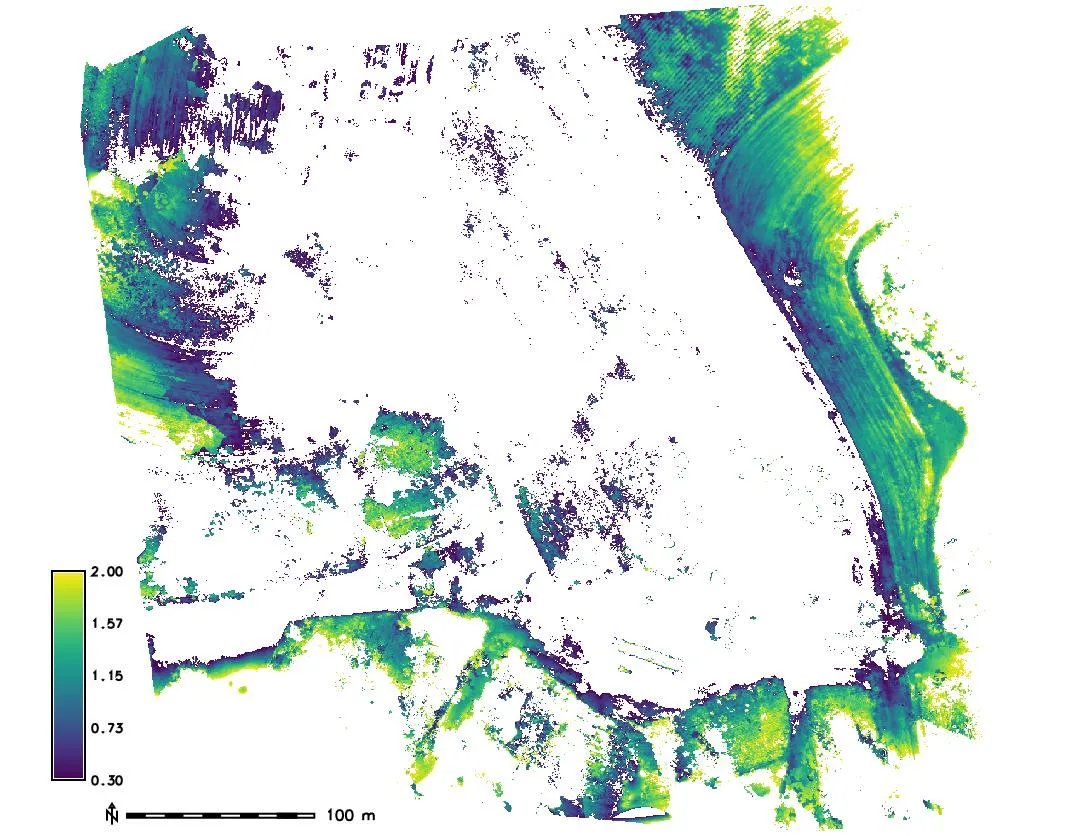
July 27
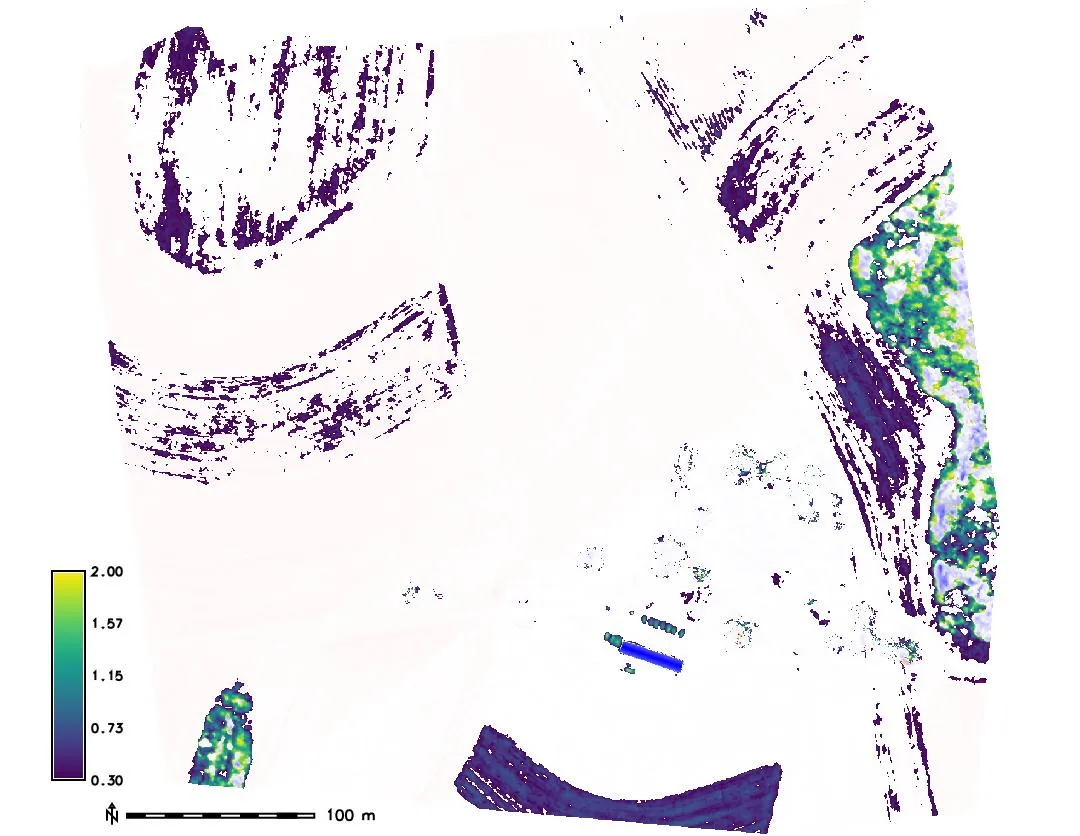
October 6
Height above the lidar bare ground between 0.3 and 2 m, from t.rast.mapcalc with if() on the fields raster
Crop volume
- Sum of the crop height over the field cells, times the cell area, is the crop volume above ground
- A proxy for above ground biomass, and its change through the season
Volume of a structure
- Difference between the DSM and the bare ground over the footprint of the feature
r.volumesums the difference over a clump of cells and reports the volume
Viewsheds on a changing surface
Cumulative viewshed: the number of observer points from which each cell is visible; r.viewshed per observer, then r.series method=count
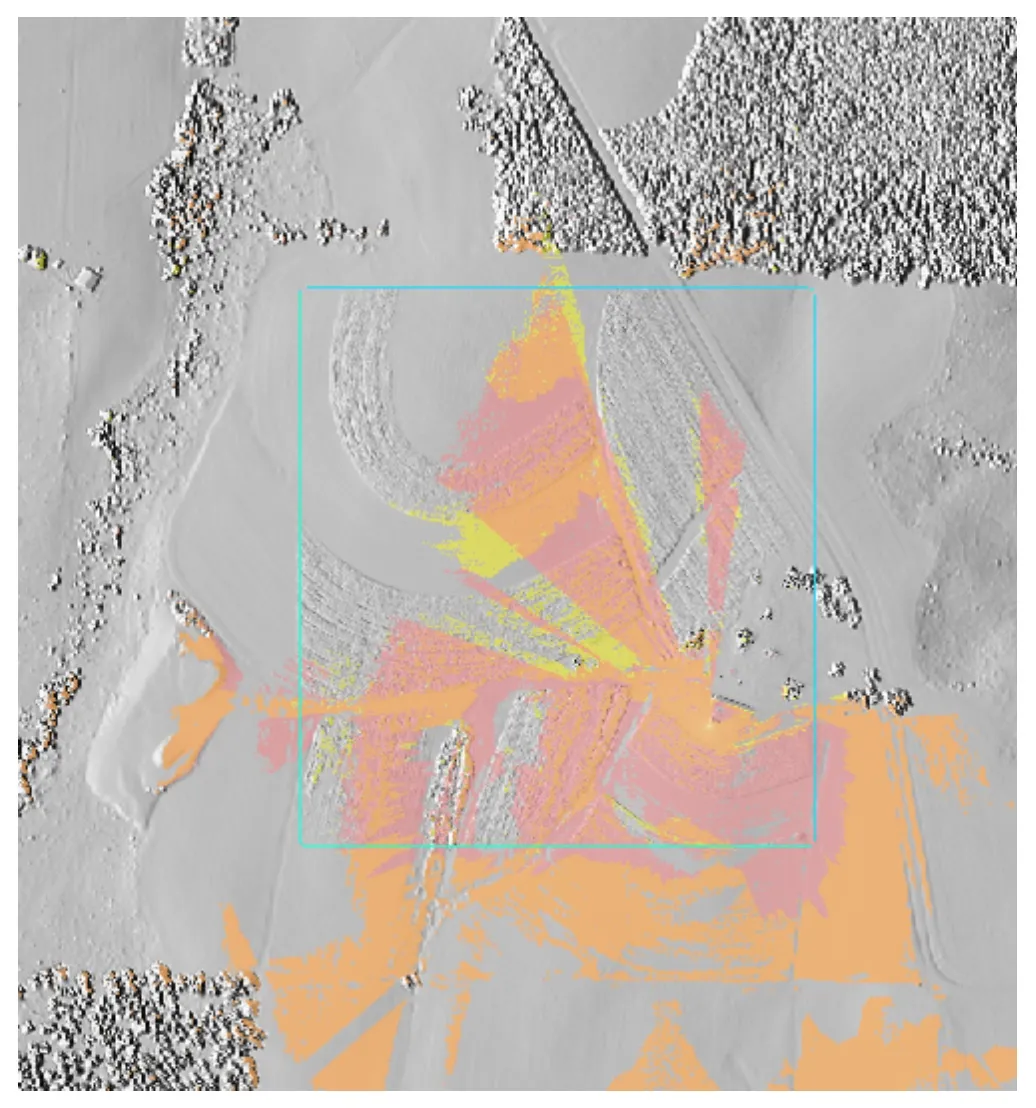
- The vegetation height decides what a camera sees, so the viewshed changes through the season
- Compute the viewshed on the lidar DSM and on the envelope DSM to see the best and worst case