flowchart TB
  A[Image - Date 1]
  B[Image - Date 2]
  A --> AF[Feature Engineering]
  B --> BF[Feature Engineering]
  AF -- Pixel or Object --> AC[Classification]
  BF -- Pixel or Object --> BC[Classification]
  AC --> CM[Change Map]
  BC --> CM
UAS-based Change Detection
Center for Geospatial Analytics at North Carolina State University
Corey White
Outline
- Selection of spatial-temporal resolution
- Determination of processing time step
- Sensor and environmental considerations
- Selection of classification schema
- Feature engineering
- Data Sampling
- Selection of classification and change detection methodology
What is Change Detection?
Why does it Matter?
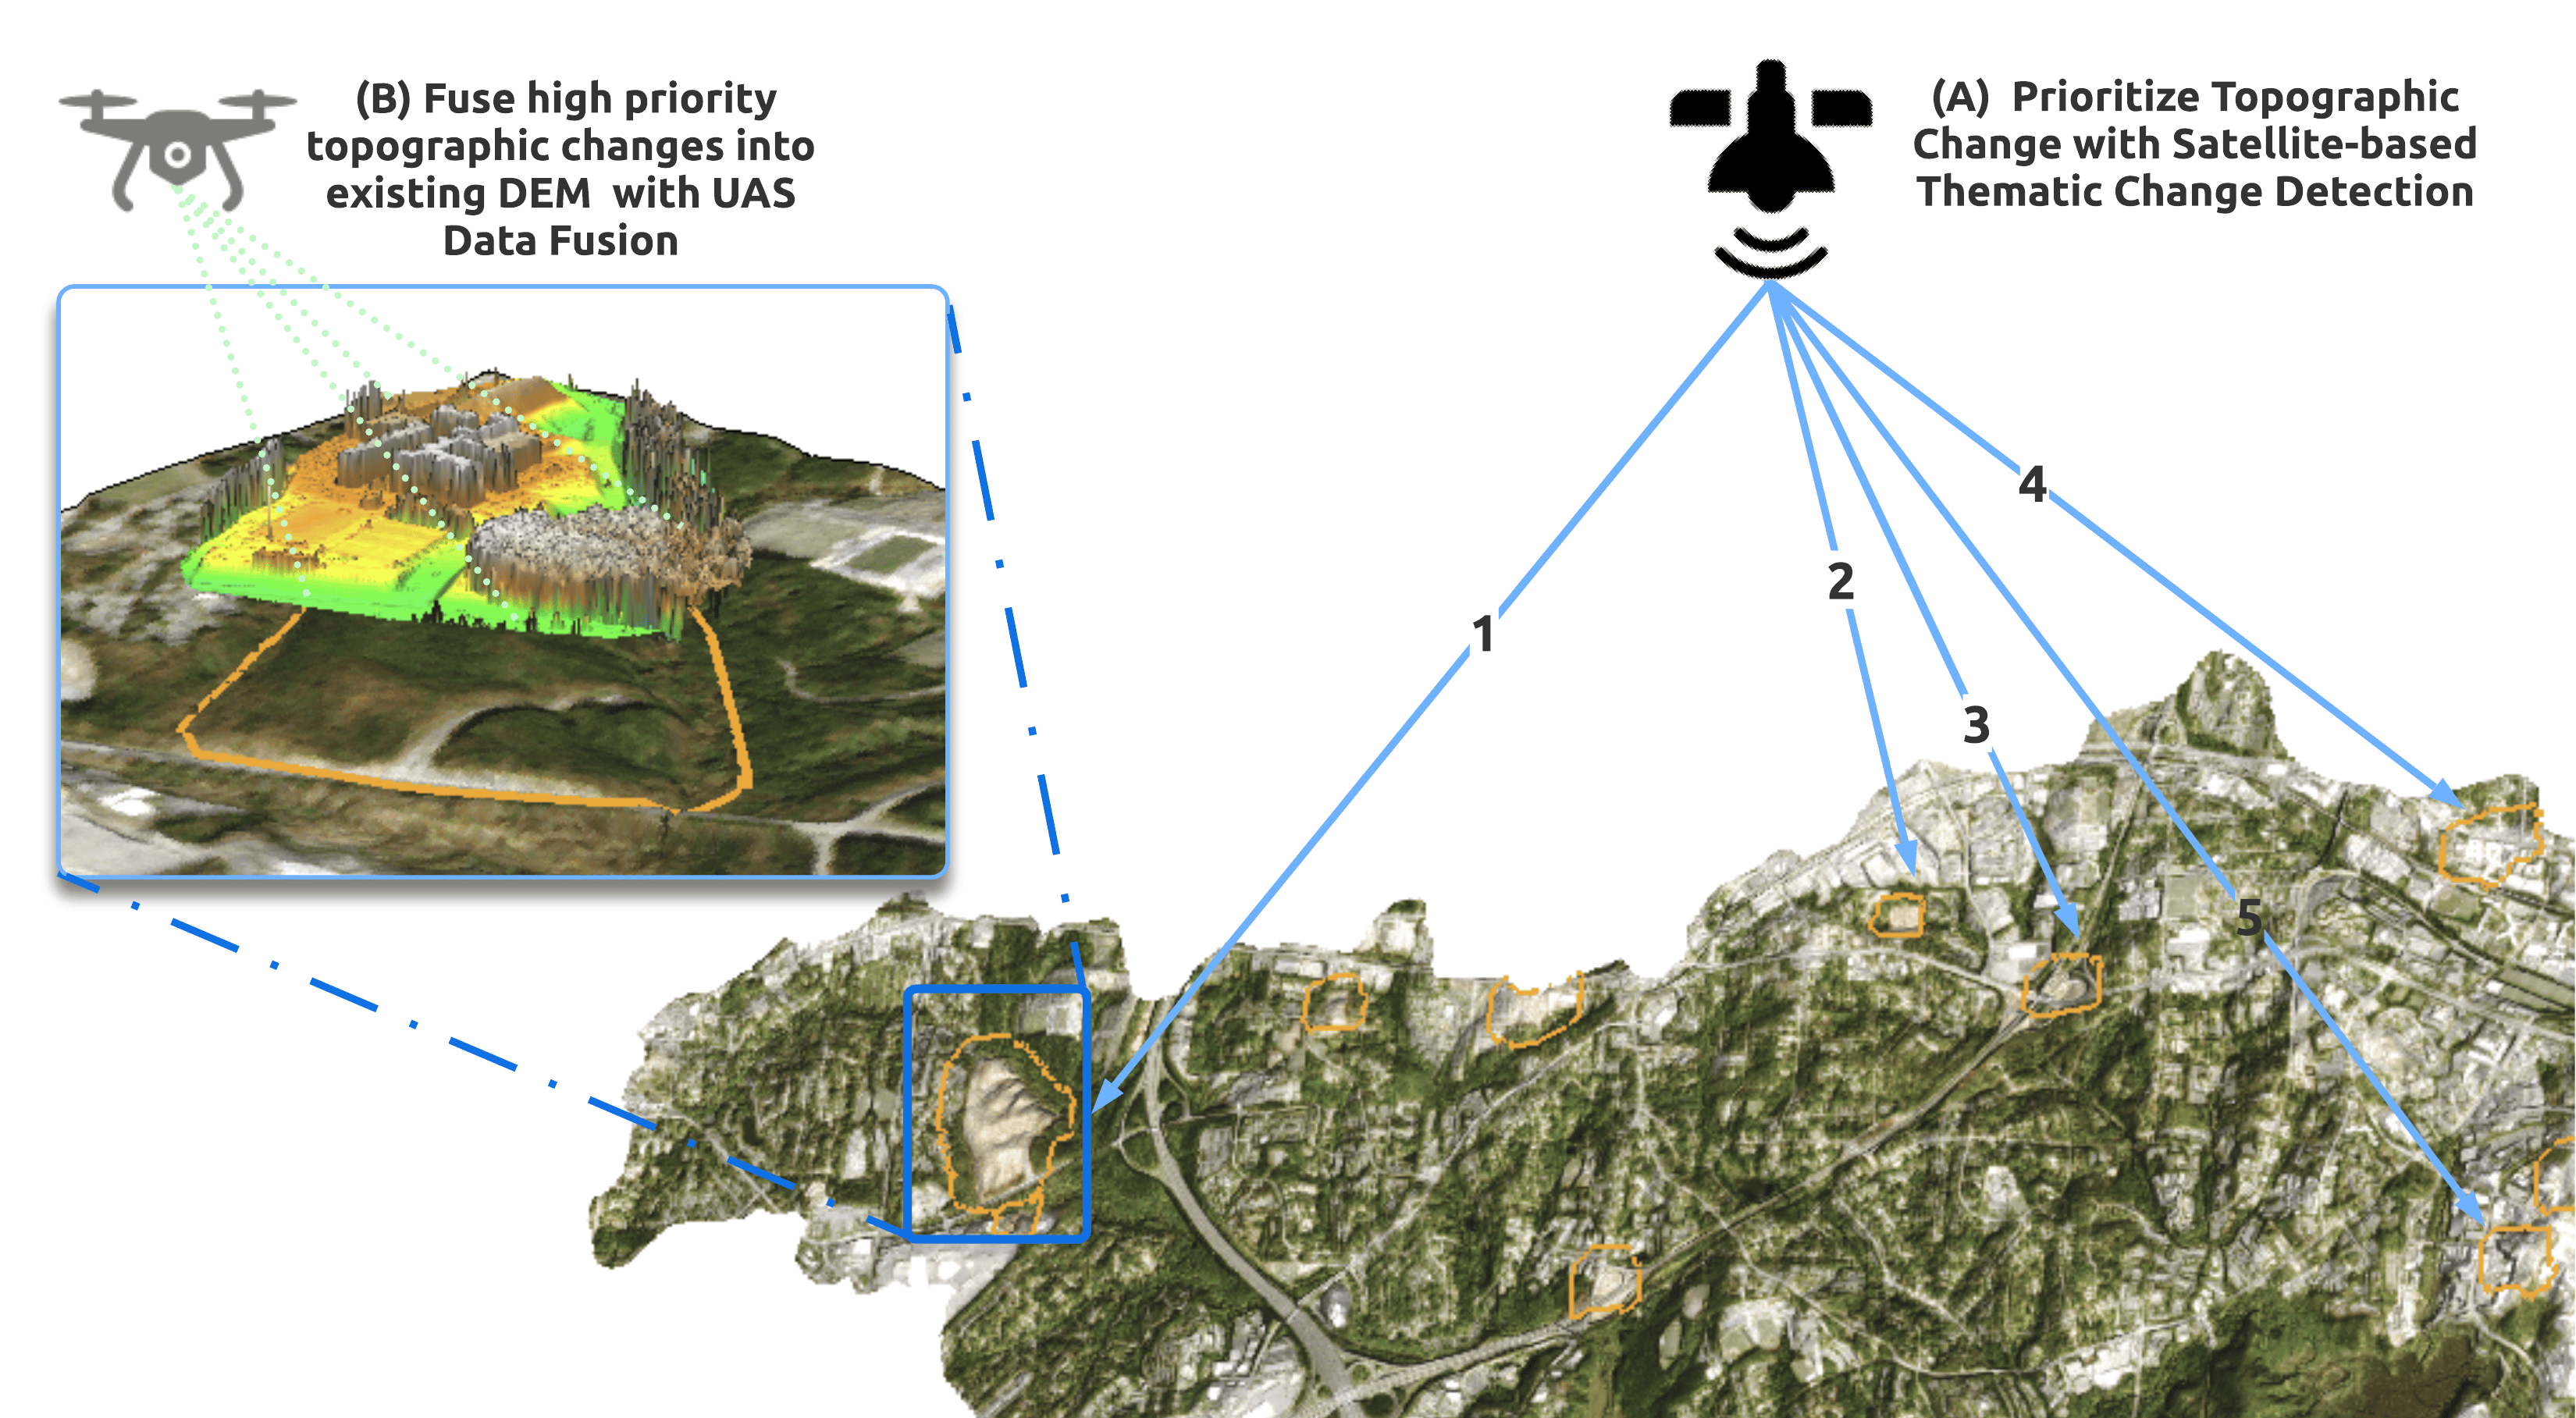
- White CT, Reckling W, Petrasova A, Meentemeyer RK, Mitasova H. Rapid-DEM: Rapid Topographic Updates through Satellite Change Detection and UAS Data Fusion. Remote Sensing. 2022; 14(7):1718. https://doi.org/10.3390/rs14071718
Process of Interest
- What process are you interested in montioring?
- Is it naturally occuring?
- Is it man made?
- Is it fast changing?
- Is it slow changing?
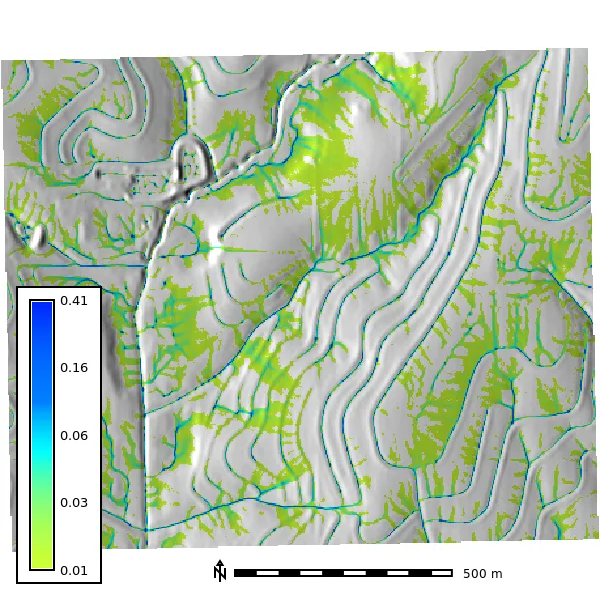
Spatial Resolution - Continous Data
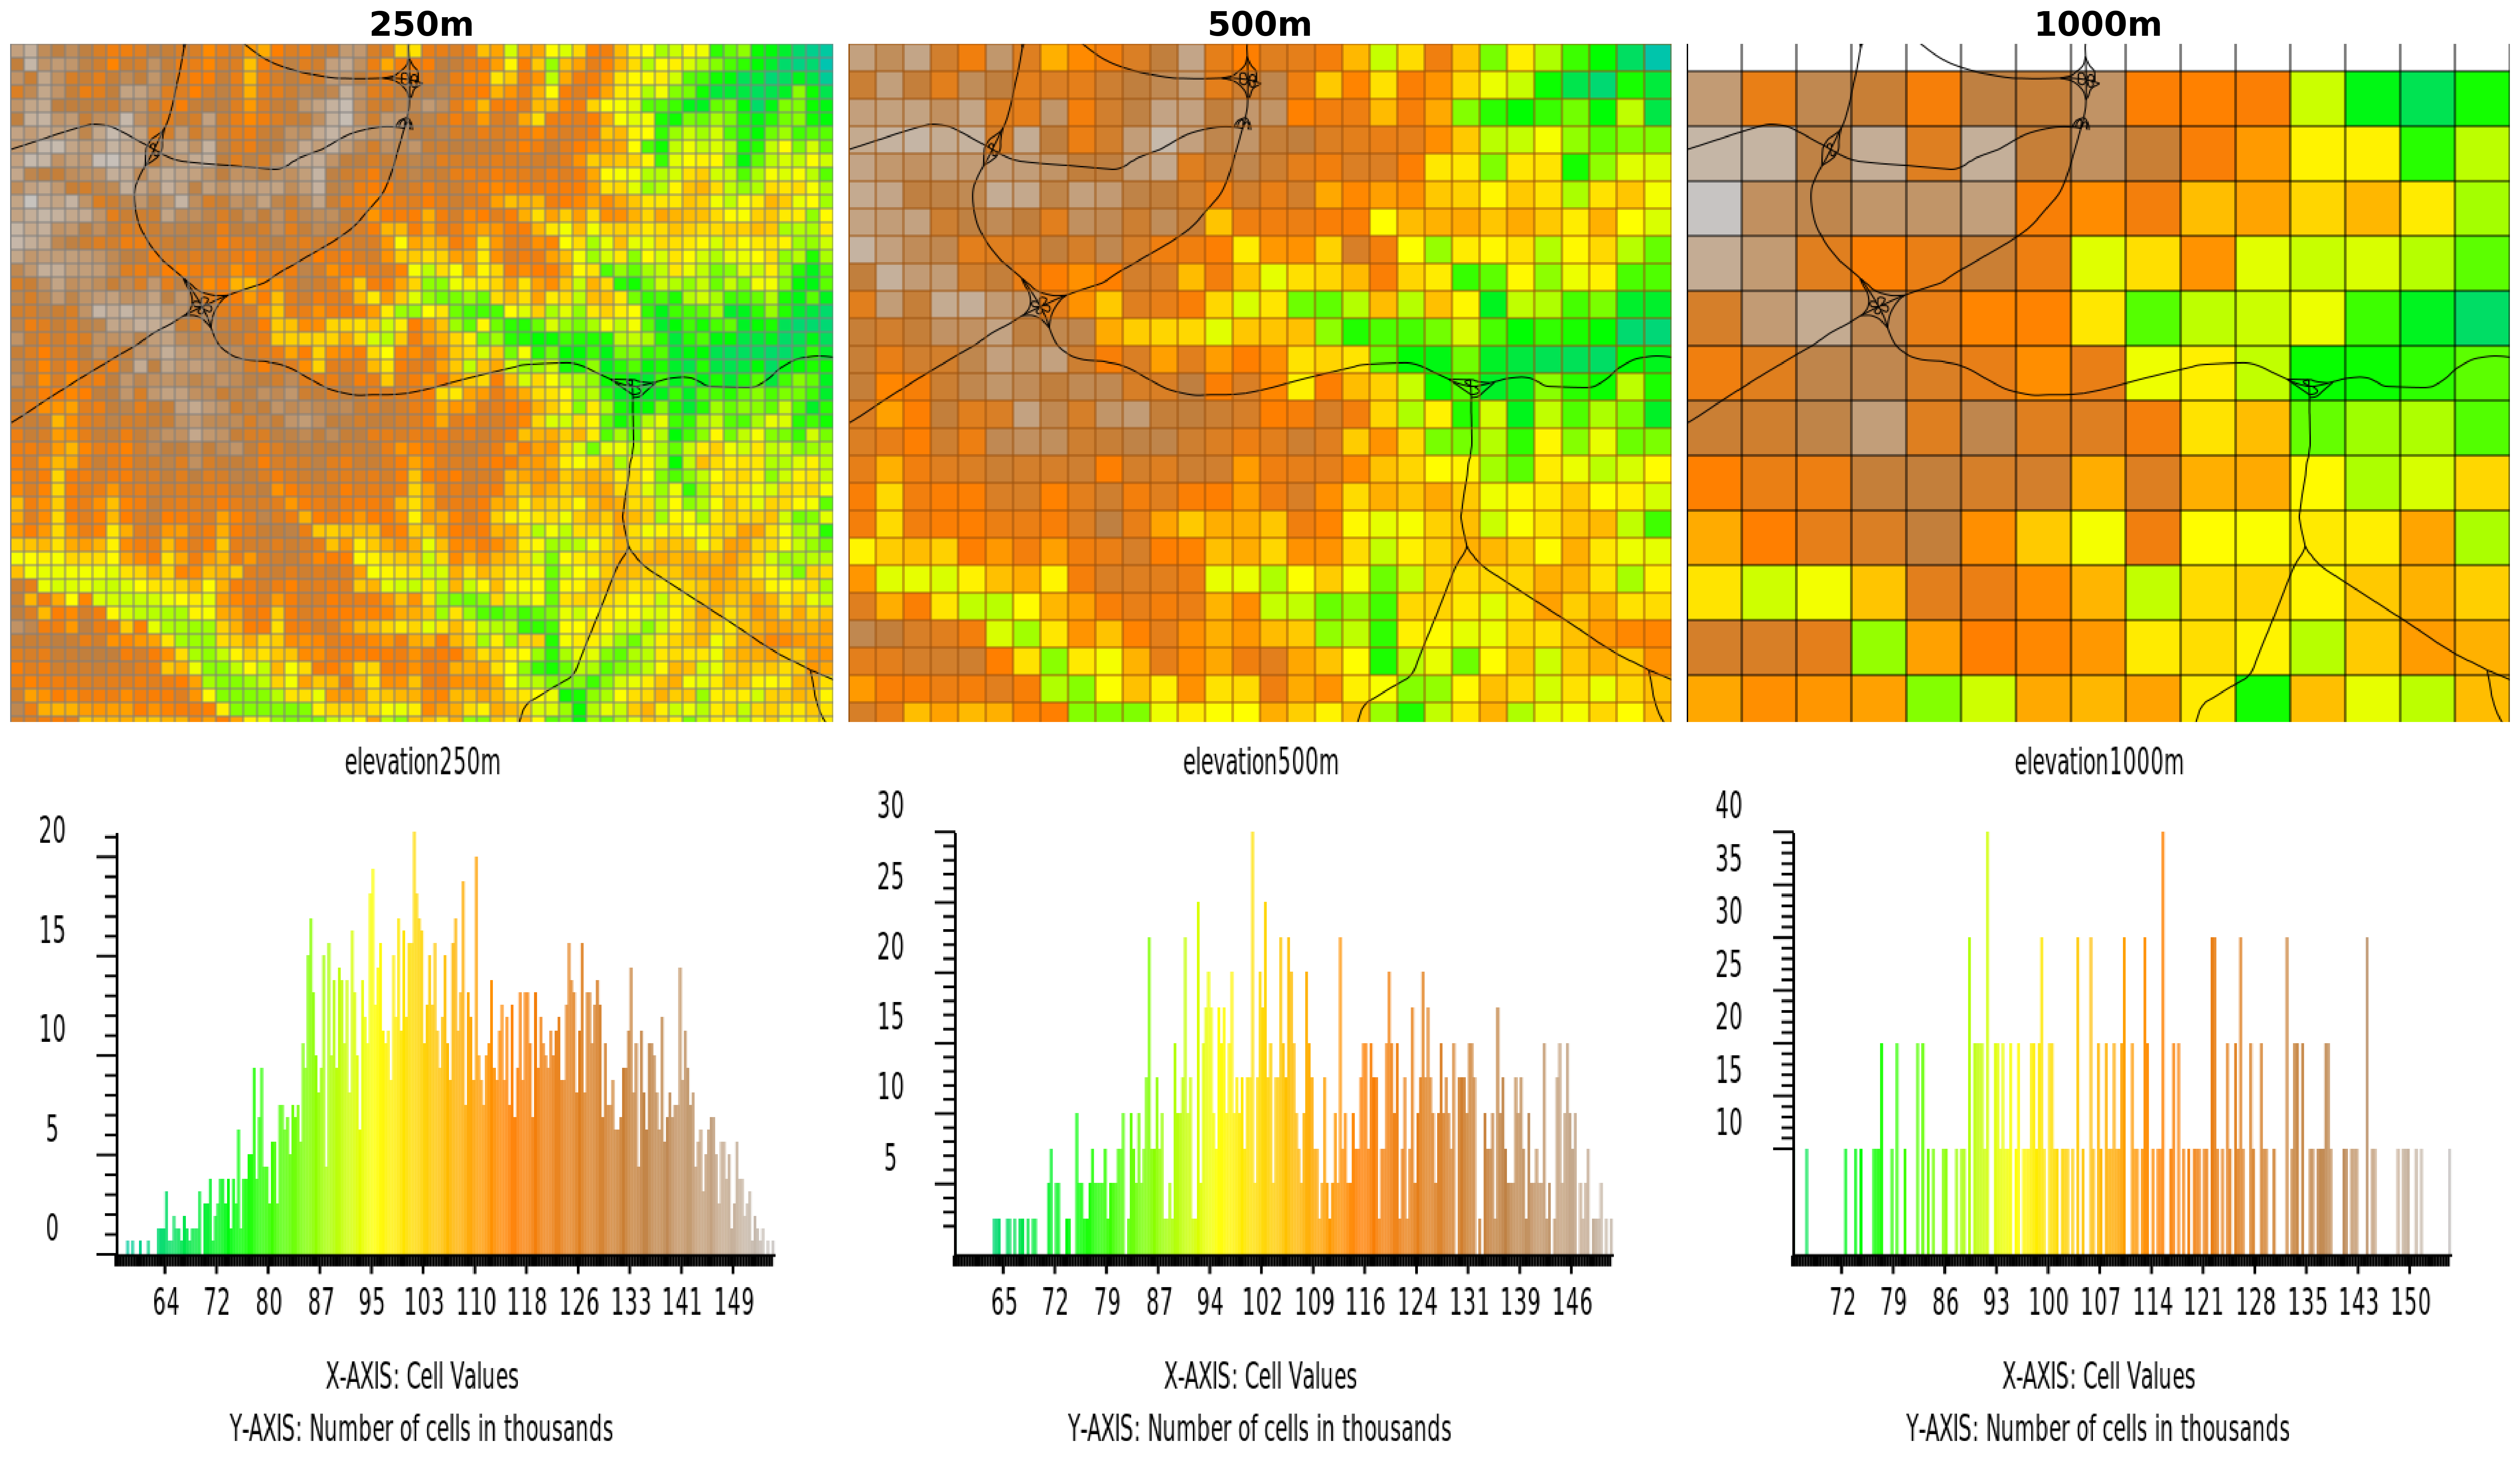
Continous Data
- Corey White, & Petras, V. (2024). tomorrownow/intro-to-geoprocessing-workshop: Zendo Release (Version 0.1.1) [Computer software]. https://doi.org/10.5281/zenodo.10764926
Spatial Resolution - Discrete Data
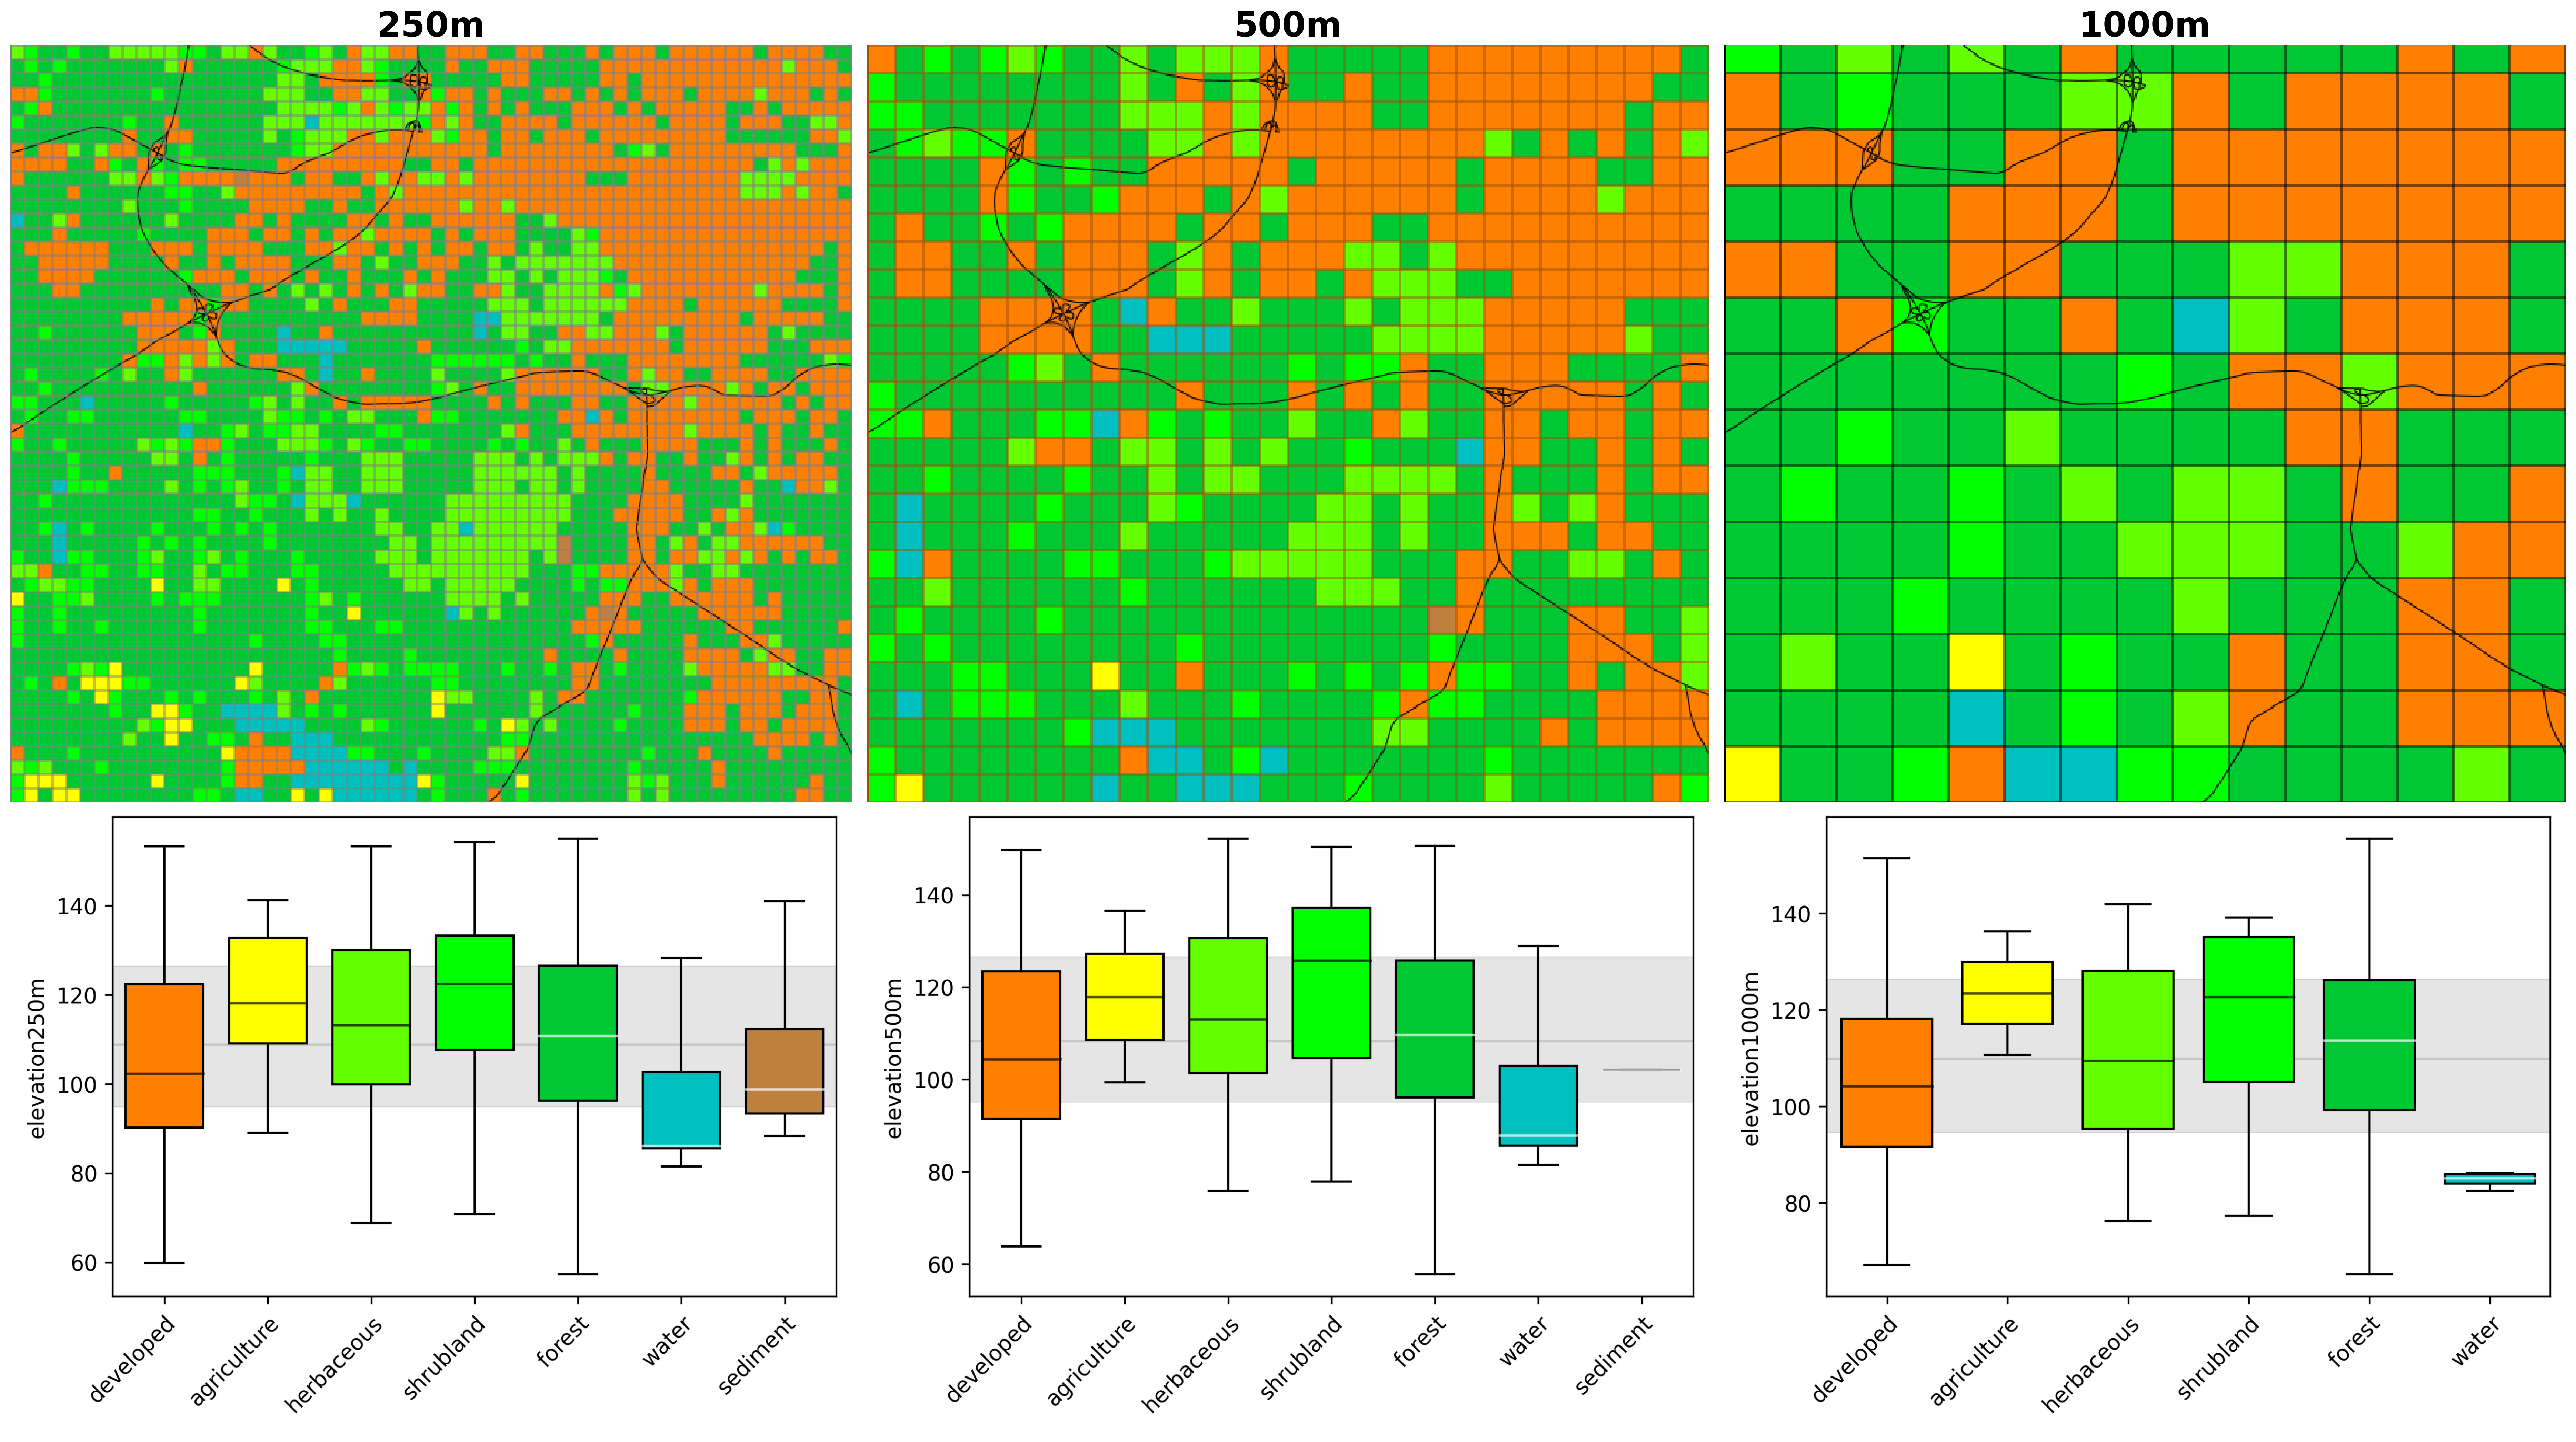
Discrete
- Corey White, & Petras, V. (2024). tomorrownow/intro-to-geoprocessing-workshop: Zendo Release (Version 0.1.1) [Computer software]. https://doi.org/10.5281/zenodo.10764926
Temporal Resolution
Minutes
Years
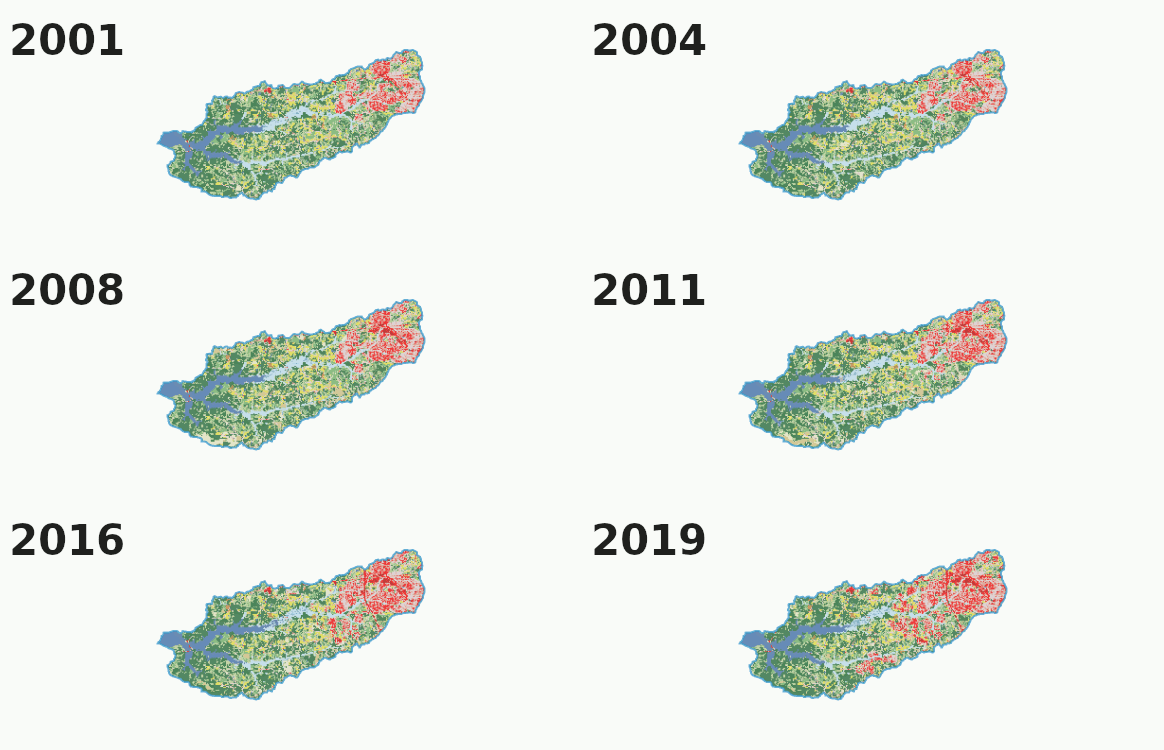
Process Time Step
Phenological considerations
- Natural variation (e.g. seasonal, extreme weather event)
- Anthroprogentic change (e.g. construction, harvest)
Discrete Time Step
- Hourly
- Daily
- Weekly
- Monthly
- Seasonally
- Annually
- Bi-annually
Continous
- Live video feed
Sensor and Environmental Considerations
Sensor
- Spatial Resolution
- Spectral Resolution
- Radiometric
Environmental
- Sun azimuth
- Sun elevation
- Cloud coverage
- Off-nadir
- Temporal resolution
- Phenological cycles
Tip
Best if conditions are as similar as possible
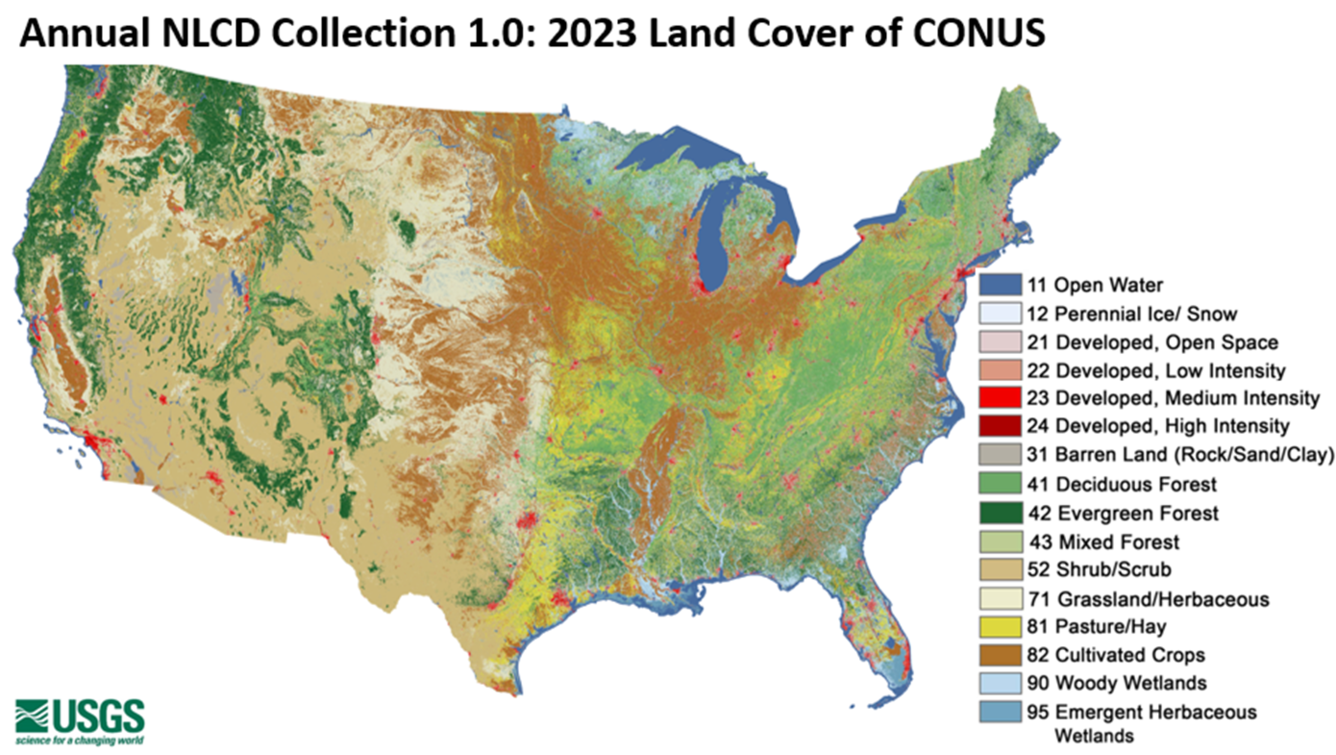
Classification Schemas
- Land Cover/Land Use
- NLCD (National Land Cover Dataset)
- NWALT (U.S. Conterminous Wall-to-Wall Anthropogenic Land Use Trends)
- Custom
Classification and Change Detection
- Change Detection Method
- Binary / Thematic
- Image Classification
- Supervised
- Unsupervised
- Classification Validation
- Confusion Matrix
- Overall Accuarcy
- Kappa
- Thematic Change
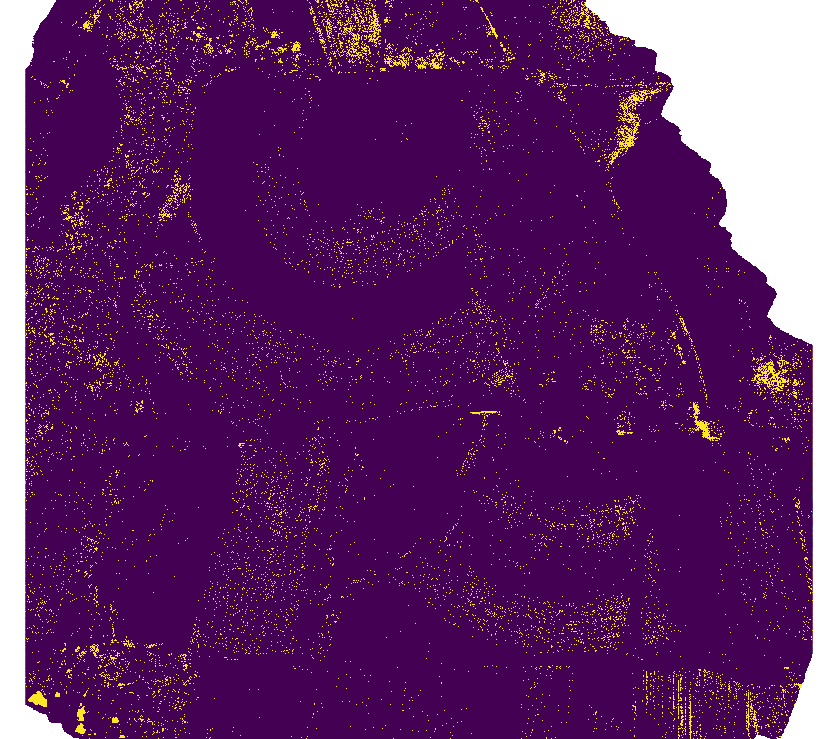
Binary Change Detection
Identify Change or no change
Methods
- Visual change detection
- Thresholds (e.g. Image Differencing)
- PCA (Principle Component Analysis)
- Logistic Classification
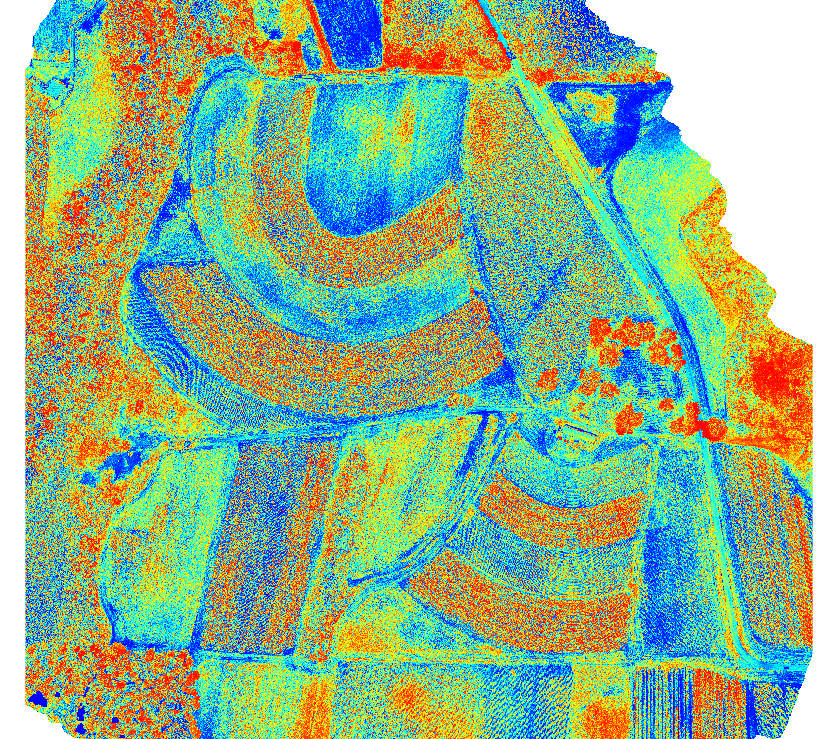
Thematic Change Dection
- Pixel-based Post-Classification Thematic Change Detection
- Object-based Post-Classification Thematic Change Detection
Pixel-based
- Medium to low resolution data
- Track per-pixel changes over time
Object-based
- Very high resolution (VHR) data (UAS data!)
- Image Segmentation
- Track objects over time
Classification Methods
Supervised Classification
- Needs labeled training data
Unsupervised Classification
- No training data needed
- Classify the results
Classification Methods
Supervised Classification Algorithms
- Random Forest
- Support Vector Machine (SVN)
- Maximum Likelihood Classification (MLC)
- Artifical Neural Networks (ANN)
Unsupervised Classification Algorithms
- K-Means Clustering
- Iterative Self-Organizing Data Analysis (ISODATA)
- Spectral Change Vector Analysis
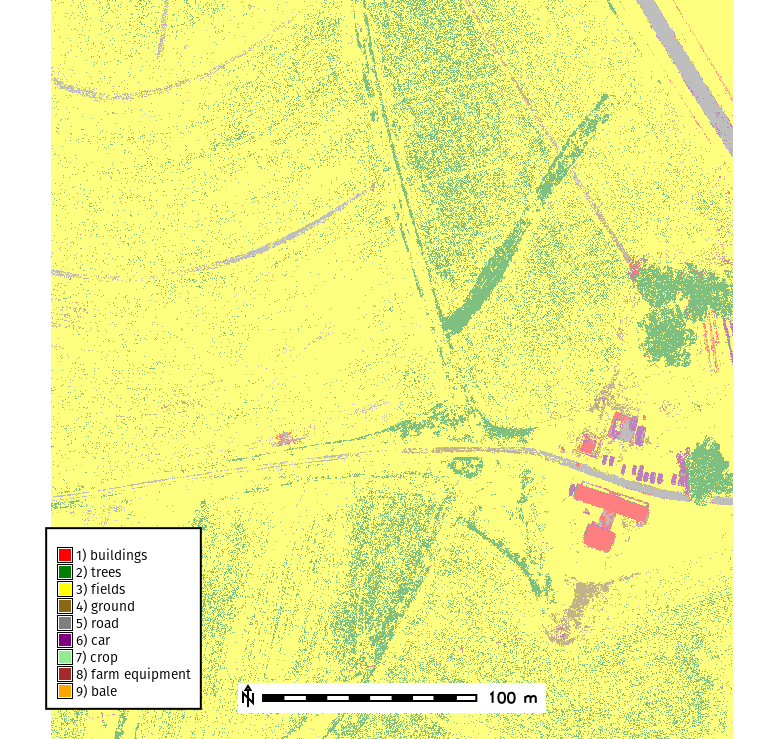
Classification Results
Model Validation
Confusion Matrix
| Reference Predicted | Forest | Water | Urban | Agriculture | User’s Accuracy (%) |
|---|---|---|---|---|---|
| Forest | 50 | 2 | 3 | 0 | 90.9 |
| Water | 1 | 45 | 0 | 4 | 88.2 |
| Urban | 2 | 1 | 40 | 7 | 80.0 |
| Agriculture | 0 | 3 | 5 | 42 | 85.7 |
| Producer’s Accuracy (%) | 94.3 | 86.5 | 83.3 | 79.2 |
- \(Overall\ Accuarcy = \frac{Correctly\ classified\ samples}{Total\ samples}\)
- Kappa coefficient (Cohen’s Kappa): inter-rater agreement
Post-Classification Change Detection
Thematic Change (from-to)
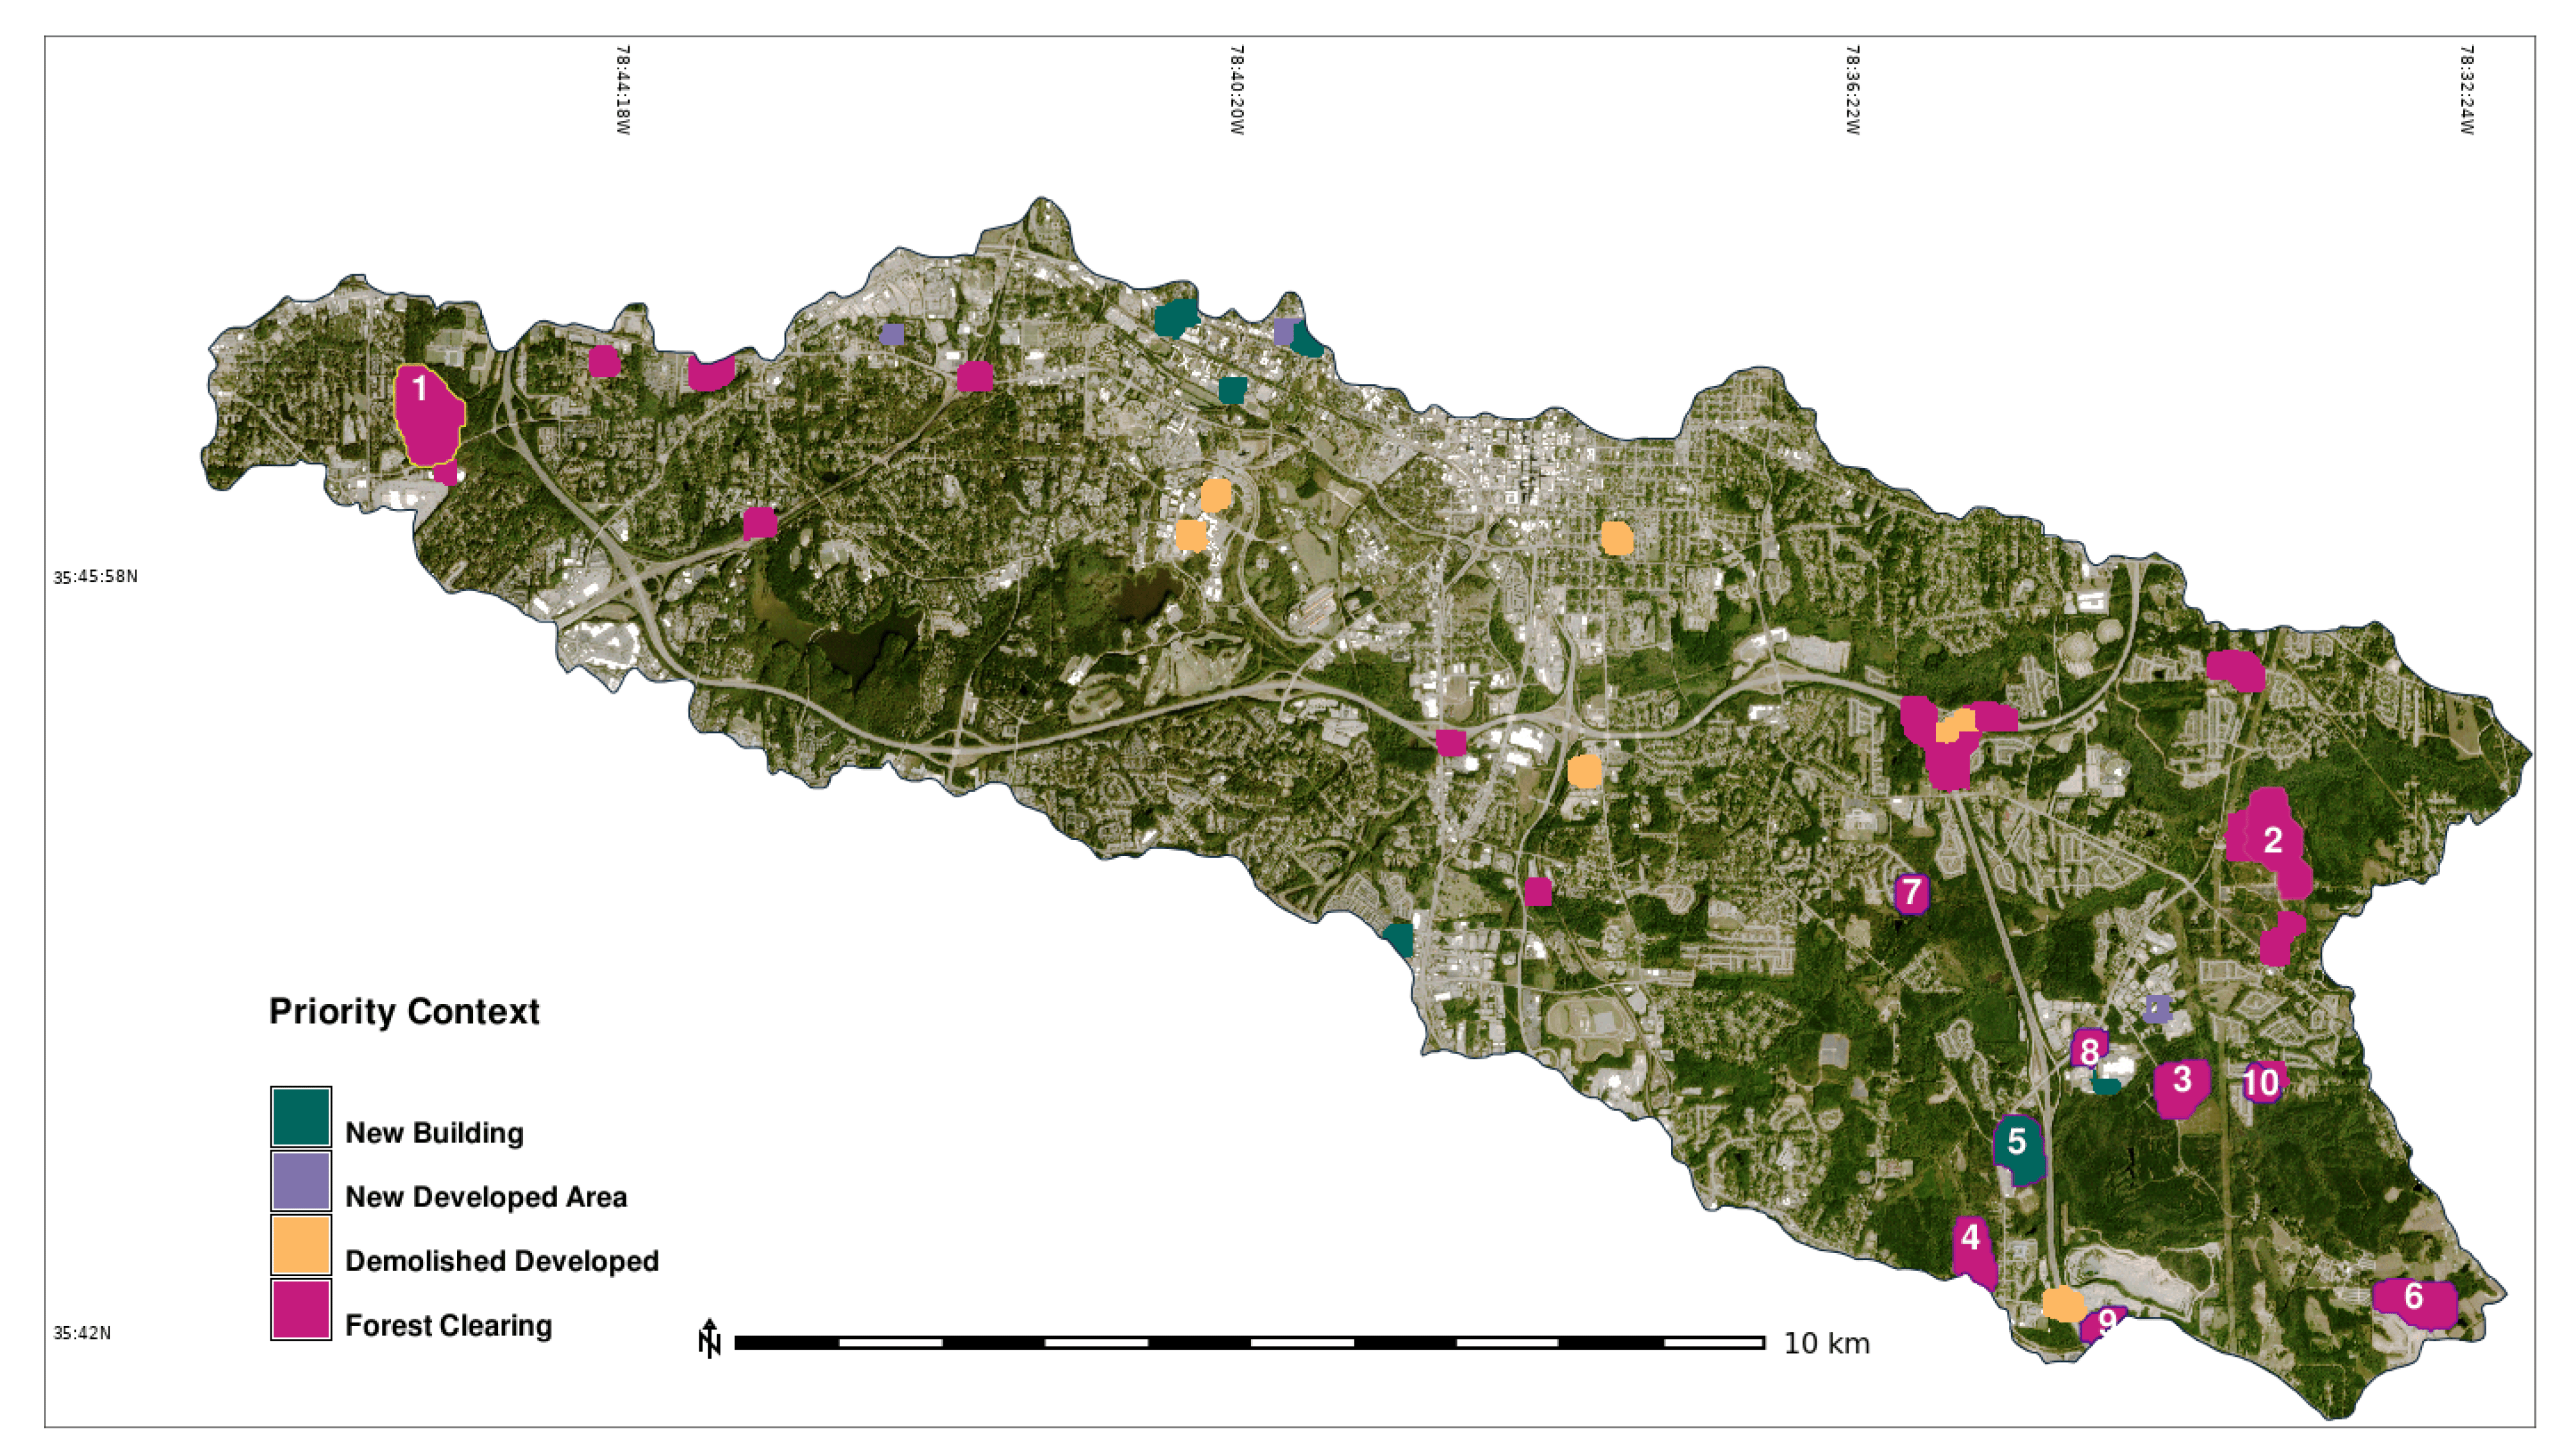
- White CT, Reckling W, Petrasova A, Meentemeyer RK, Mitasova H. Rapid-DEM: Rapid Topographic Updates through Satellite Change Detection and UAS Data Fusion. Remote Sensing. 2022; 14(7):1718. https://doi.org/10.3390/rs14071718