FOSS4G 2017
Immersive Tangible Modeling with Geospatial Data
Payam Tabrizian, Anna Petrasova, Brendan Harmon, Vaclav Petras, Helena Mitasova
North Carolina State University
Good morning everyone and thank you x for introduction, today I will talk
about Immersive Tangible landscape modelling.
The talk is presented by the GeoForAll Laboratory at the
Center for Geospatial Analytics (CGA), North Carolina State University
CGA is an interdisciplinary research and education center with focus on
geospatial computing, modeling, analytics and geovisualization.
geospatial.ncsu.edu
Which is a project we developed at NCStates' GeoForAll laboratory to make landscape design process more effective through the use of Tangible interaction,
Immersive virtual environments, and geospatial analytics.
Geoforall lab is part of the Center for Geospatial Analytics, which focuses on geospatial computing, modeling, analytics and geovisualization.
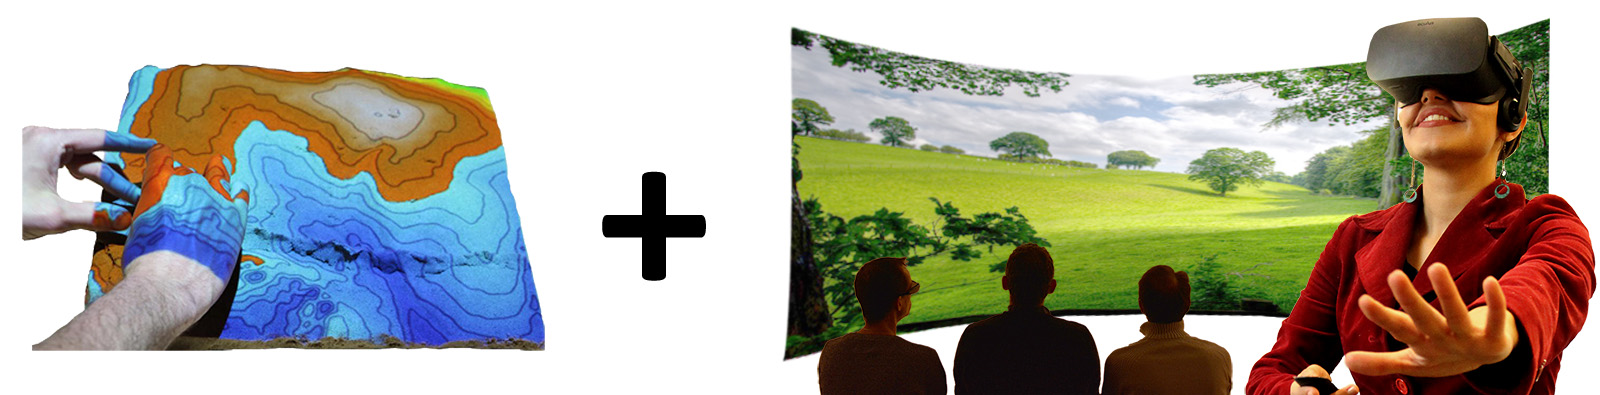
Tangible Landscape
Immersive Virtual Environment (IVE)
I will specifically discuss why and how we coupled Tangible landscape- a tangible interface for GIS and an immersive virtual environment and to make ecological design process more effective,
and more imporantly how this technology can potentialy help bridging the gaps between experiential and ecological analysis of landscape.
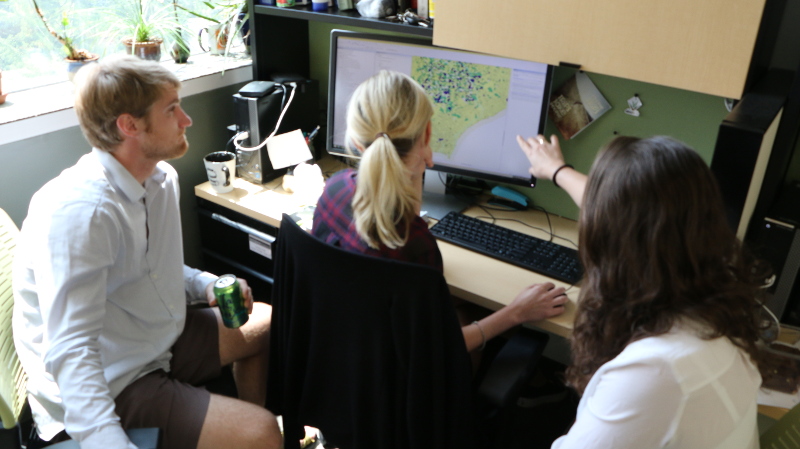
Why tangible geospatial modeling interfaces?
Interaction through mouse, keyboard and display does not encourage creativity.
Working with geospatial models and analysis is not intuitive and requires specialized software and training.
Collaboration is restricted as typically only one user at a time can navigate and modify models.
I am sure this photo shows a familiar setting - we often get together around a screen to solve a design problem or use mouse or touch
to manipulate 3D data on 2D screen. Such manipulation of data often requires knowledge of a specific,
often complex software, usually only single person can access the data
creating barriers to collaboration and creativity.
Tangible user interfaces can adress some of these issues. Instead of dealing complex user interfaces,
they afford more natural and intuitive interaction with geospatial data and analytics by offloading much of the cogtnitive load onto the body.
Tangible Landscape: real-time coupling with GIS
With Tangible Landscape you can hold a GIS in your hands - feeling the shape of the earth, sculpting its topography, and directing the flow of water.
My collegues at CGA cener we have developed a tangible user interface- so called tangible landscape.
We were able to take advatage of the fast and relatively accurate 3D scanning by Kinect
and developed the first system with real-time coupling of a 3D physical model, with GIS.
This video should give you a basic idea of the interaction - using a model of a real landscape,
we can modify the topography and get instant feedback on how our changes impact water flow and ponding.
The system is powered GRASS GIS, an open-source software for geospatial modelling and anaysis.
This affords us to flexibly integrate various algorithms and simulation ranging from water flow to landuse change modelling and even fire and disease spread modelling.
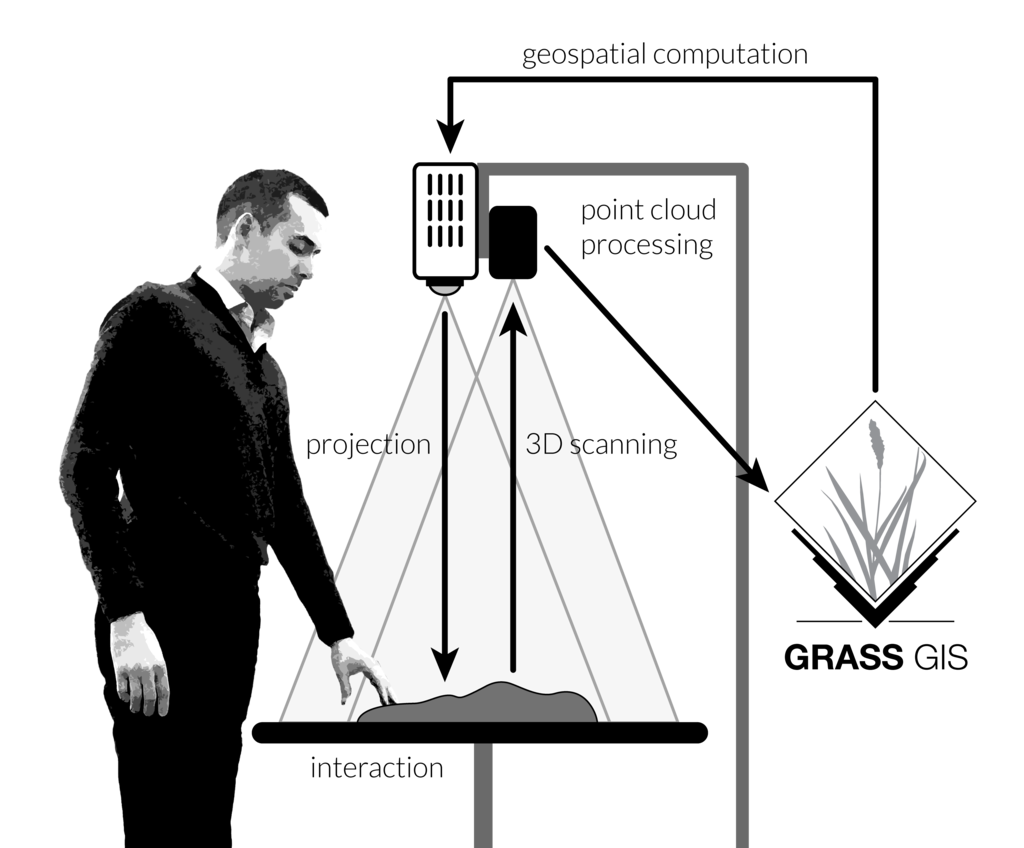
How it works
Tangible Landscape couples a digital and a physical model through a continuous cycle of 3D scanning, geospatial modeling, and projection
So how does the system work? In the previous slide you saw a Physical model of a landscape whichmade from kinetic sand.
This model is continuously scanned by the kinect, the scanned data are imported into GRASS GIS,
where a 3D digital elevation model is computed and a selected analysis or modeling is performed. A composite image
of the selected map layers is then projected over the model. In this way the system couples
the digital and physical models in a continuous cycle of scanning, modeling and projection,
providing the user continuous feedback.
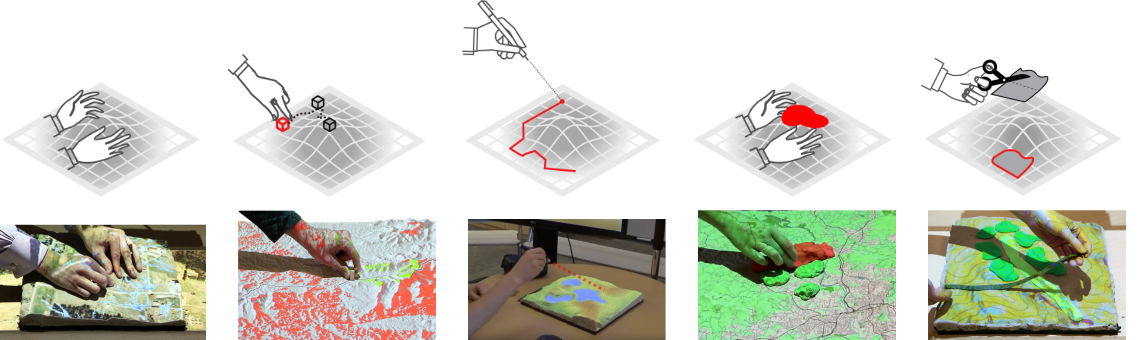
Interactions
surface
points
lines
areas
areas
To make Tangible Landscape more flexible, we developed multiple ways to interact with the physical models.
Here we use tangible objects, like a wooden marker to specify point locations on the landscape,lets say view points or trailheads, single trees and etc.
Applications: visibility
Your browser does not support the video tag.
Visibility analysis
Topography is directly linked to visibility, so here we explore viewsheds at our campus.
The physical model from sand represents digital surface model with canopy and we place the markers to specify viewpoints.
Once the marker is detected, the viewshed is dynamically computed and visualized, here the visible areas are represented by yellow color.
Applications: urban growth
Simulation of urban growth scenarios with FUTURES model
We coupled TL with urban growth model called FUTURES which is developed at North Carolina State University.
By placing colored sand we create red zones which attract new development or green zones for conservation.
The height of the sand can represent the intensity - in other words, how much the zone attracts the development.
Then we identify the polygons and rerun the urban growth model with these new conditions.
After the users remove the sands, you will observe the animated growth of the city as predicted by the FUTURES based on the specified interventions.
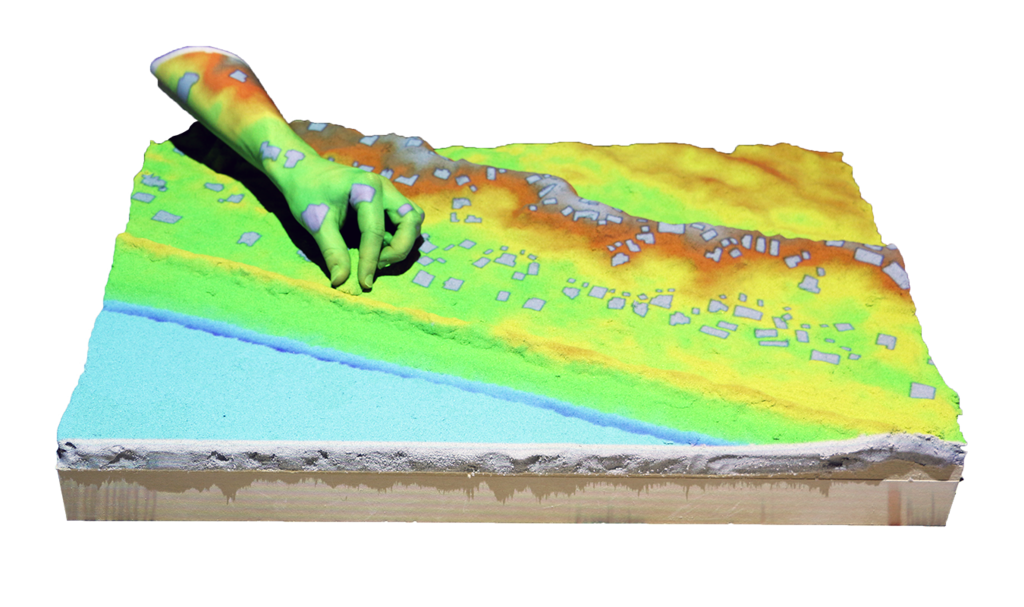
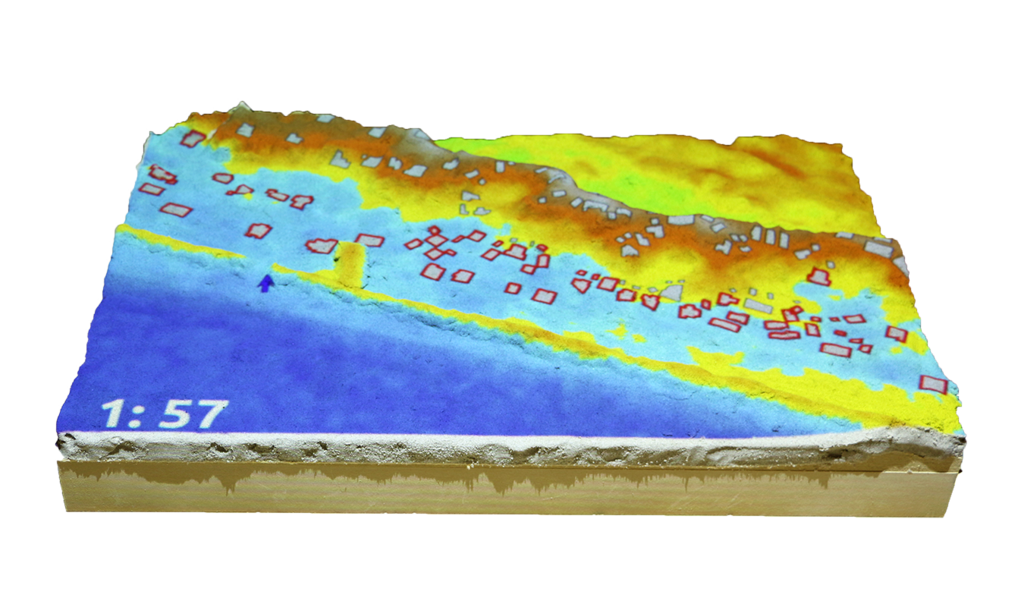
Serious games: coastal flooding
Save houses from coastal flooding by building coastal defenses
Structured problem-solving with rules, challenging objectives, and scoring
We thought Tangible Landscape would be a great tool for serious gaming- an emmerging field and promissing medium to engage public in science.
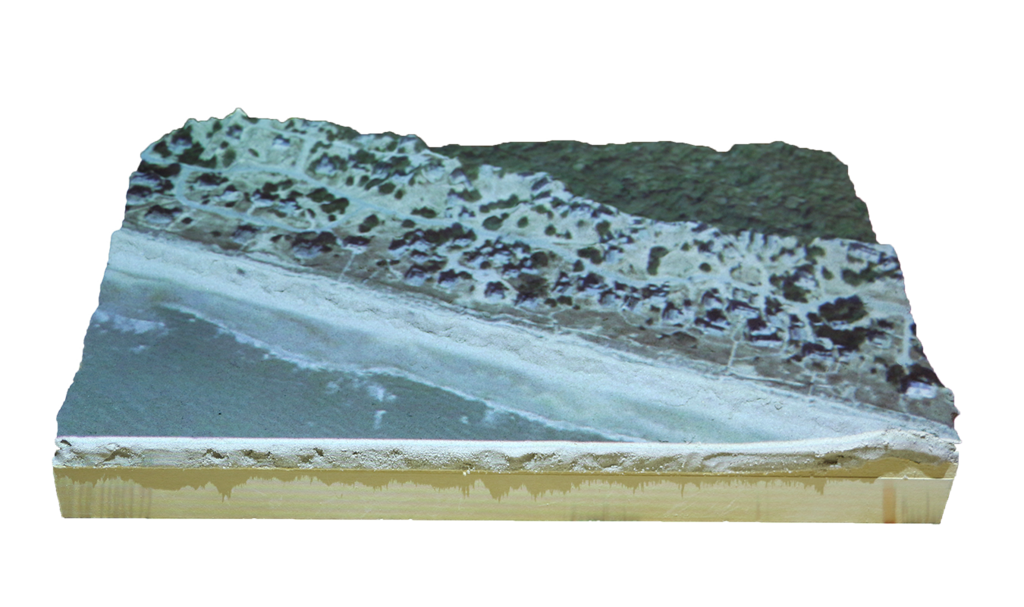
We prepared a coastal flooding game for a public event. The model is created from a digital surface model of Baldhead Island in North Carolina's outer banks. We asked players to protect the residents on the coast when a foredune is breached during a storm surge.
With limited sand budget they tried different ways of building barriers and, we were surprised by how quickly they learned how a breach in one place can cause flooding of houses which are far away from the breach.
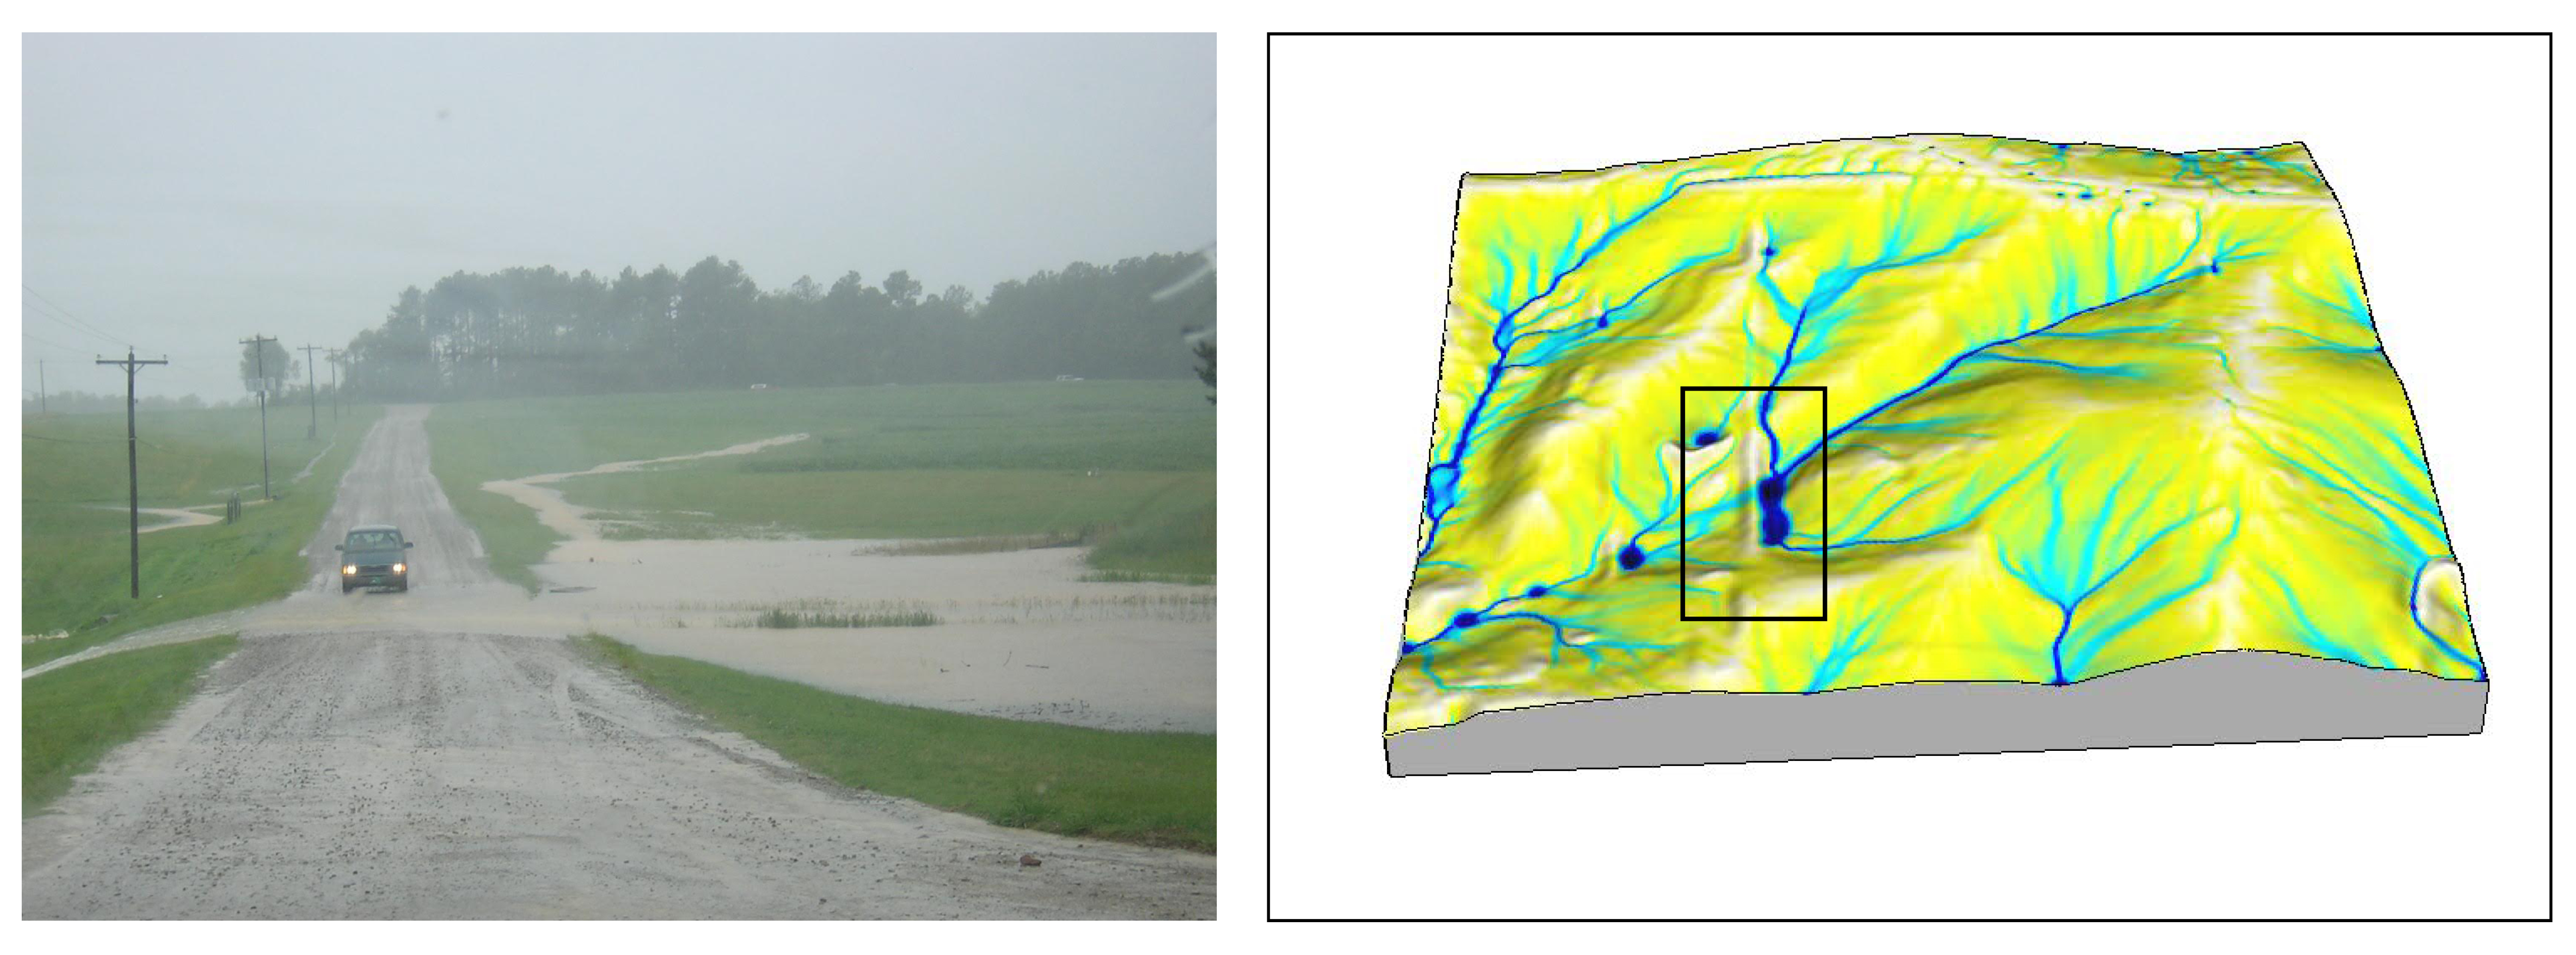
Perspective view of inundated landscape Surface inundation and flow model
As you have seen so far, Tangible Landscape represents the landscape as a projection-augmented model which is perceived in a bird’s-eye perspective.
So it is not capable of fully representing the real-world experience of geospatial feature or phenomenon, in the way that we perceive it in human view.
The coupling rationale
Real-time updating a georeferenced 3D model of the landscape based on user interaction with Tangible Landscape
Updating the attributes (shape, position) of 3D objects (e.g., plants) and surfaces (e.g., terrain) with their corresponding tangible objects
Enabling user to control the viewpoints (camera position) and animation (e.g., walkthrough, flythrough)
! And thats why Tangible Landscape with VR !
The idea was to generate a georeferenced 3D model of the under-study model,
in which all the features and behavior of 3D elements like trees, buildings and surfaces are linked to their corresponding tangible object in
tangible landscape. In this way, as users manipulate the tangible model and pieces, they can see, in real time, the changing landscape rendered on display or through virtual reality headsets like oculus.
Additionally, we wanted to empower users to control the camera and animation so they can step into and navigate in their desired location in the landscape.
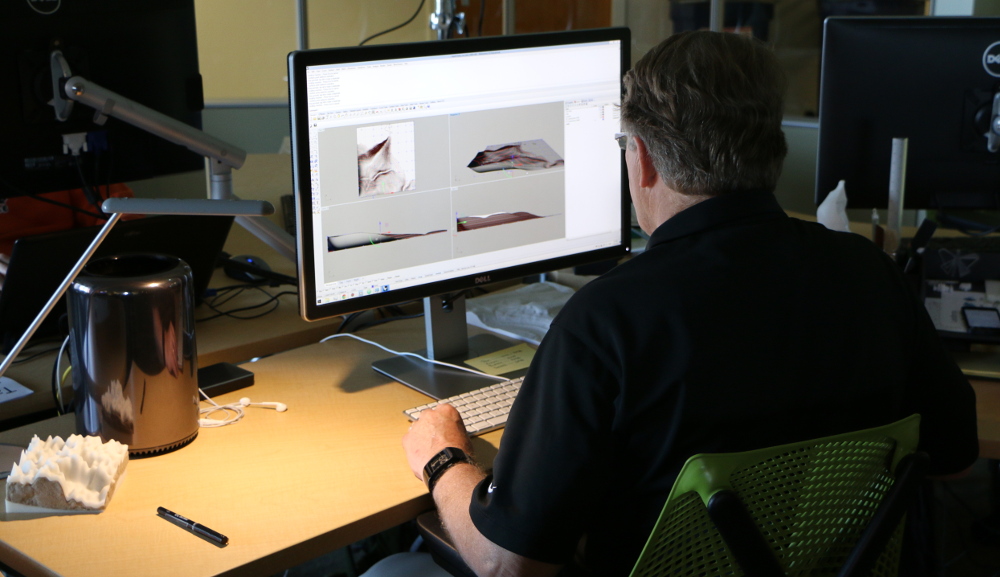
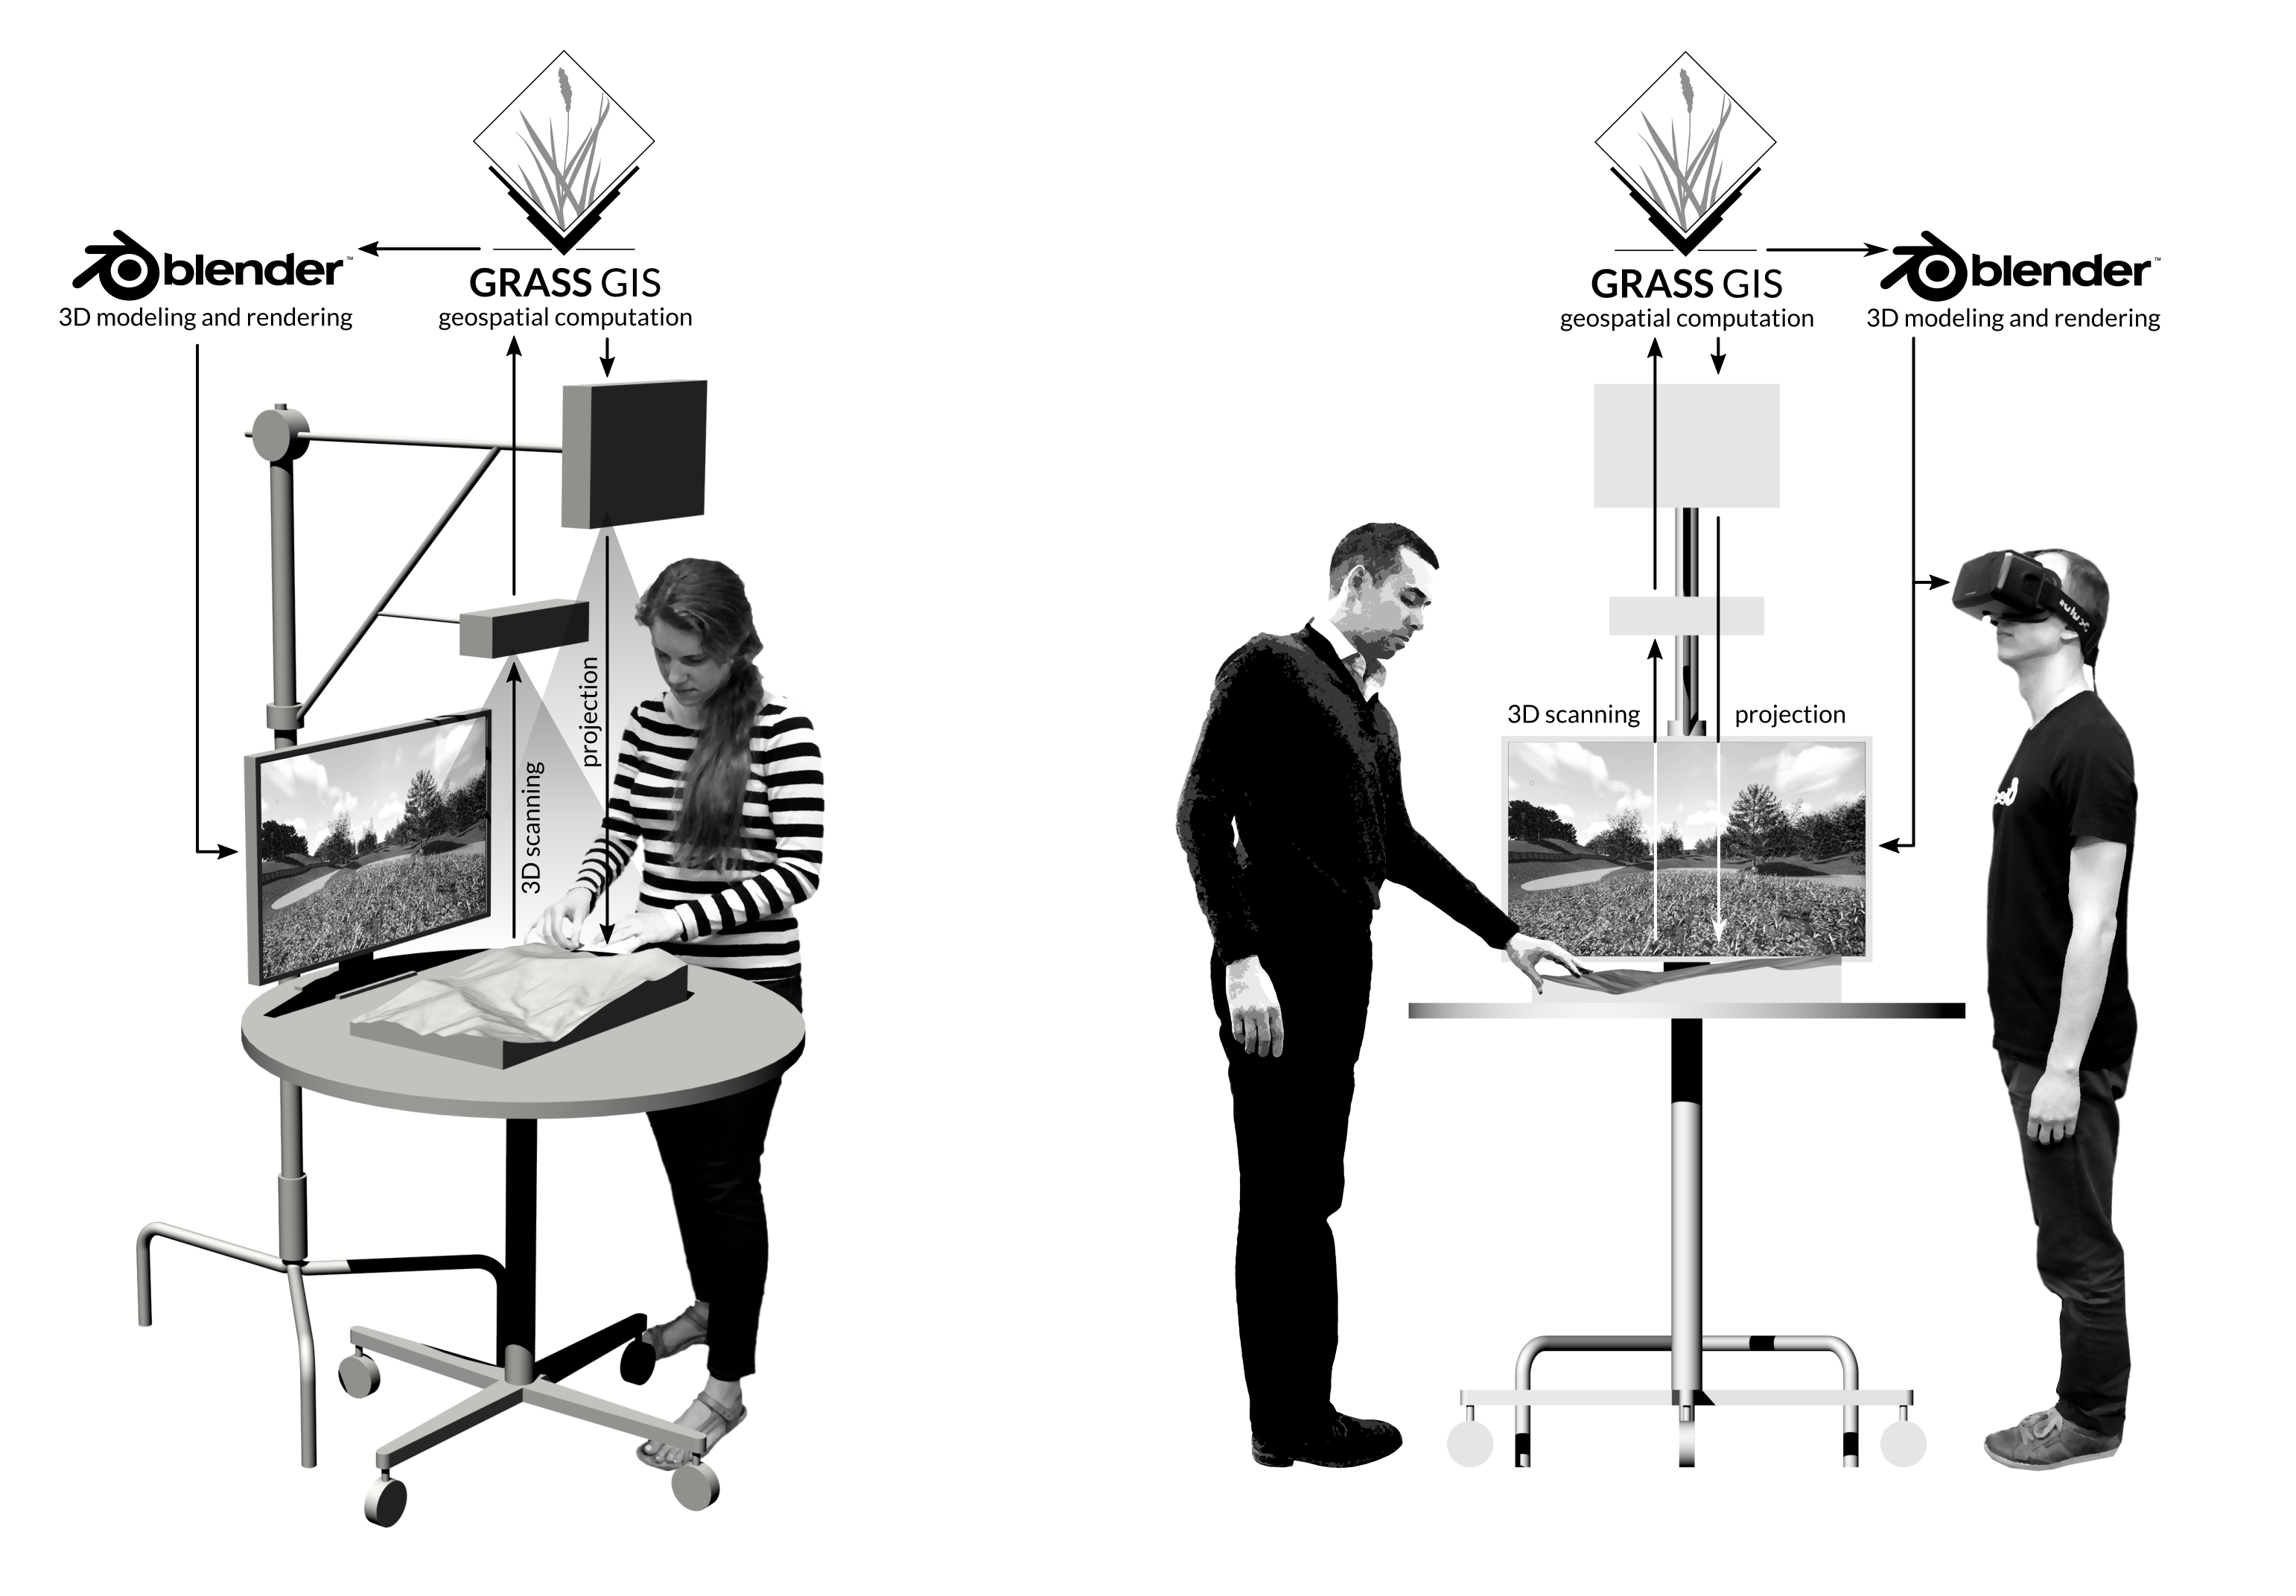
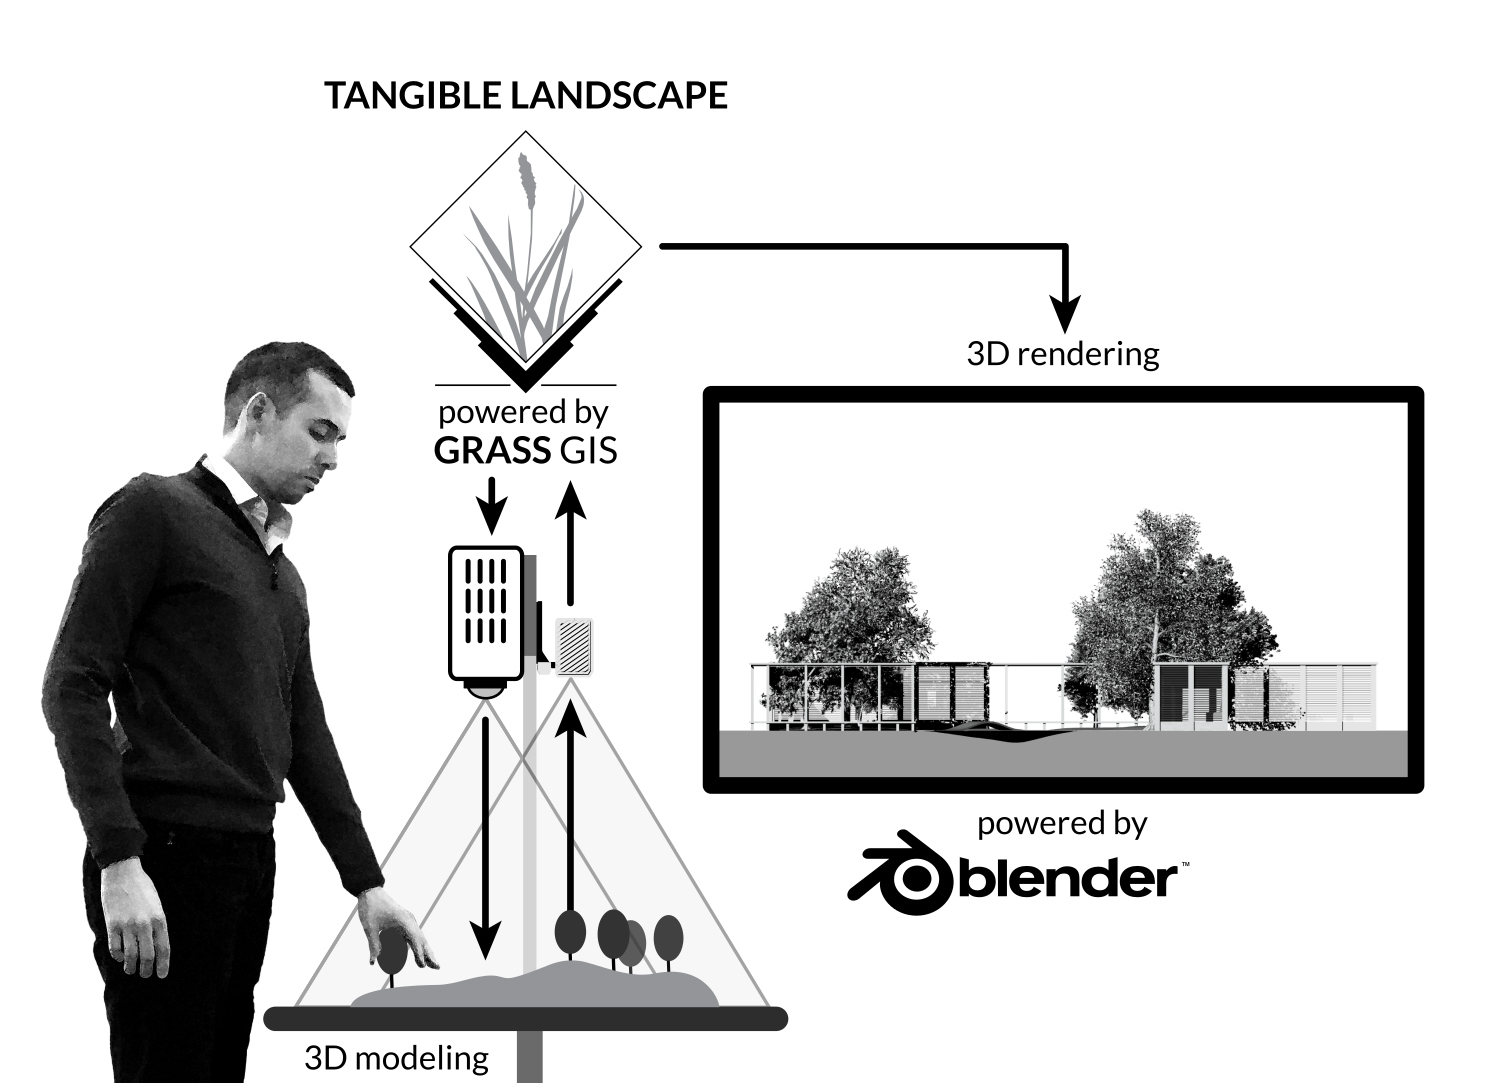
Physical setup
For implementing the concept, we added a 3D modeling and game engine software, called blender,
to the tangible landscape setup with outputs to a display and an immersive virtual reality headset.
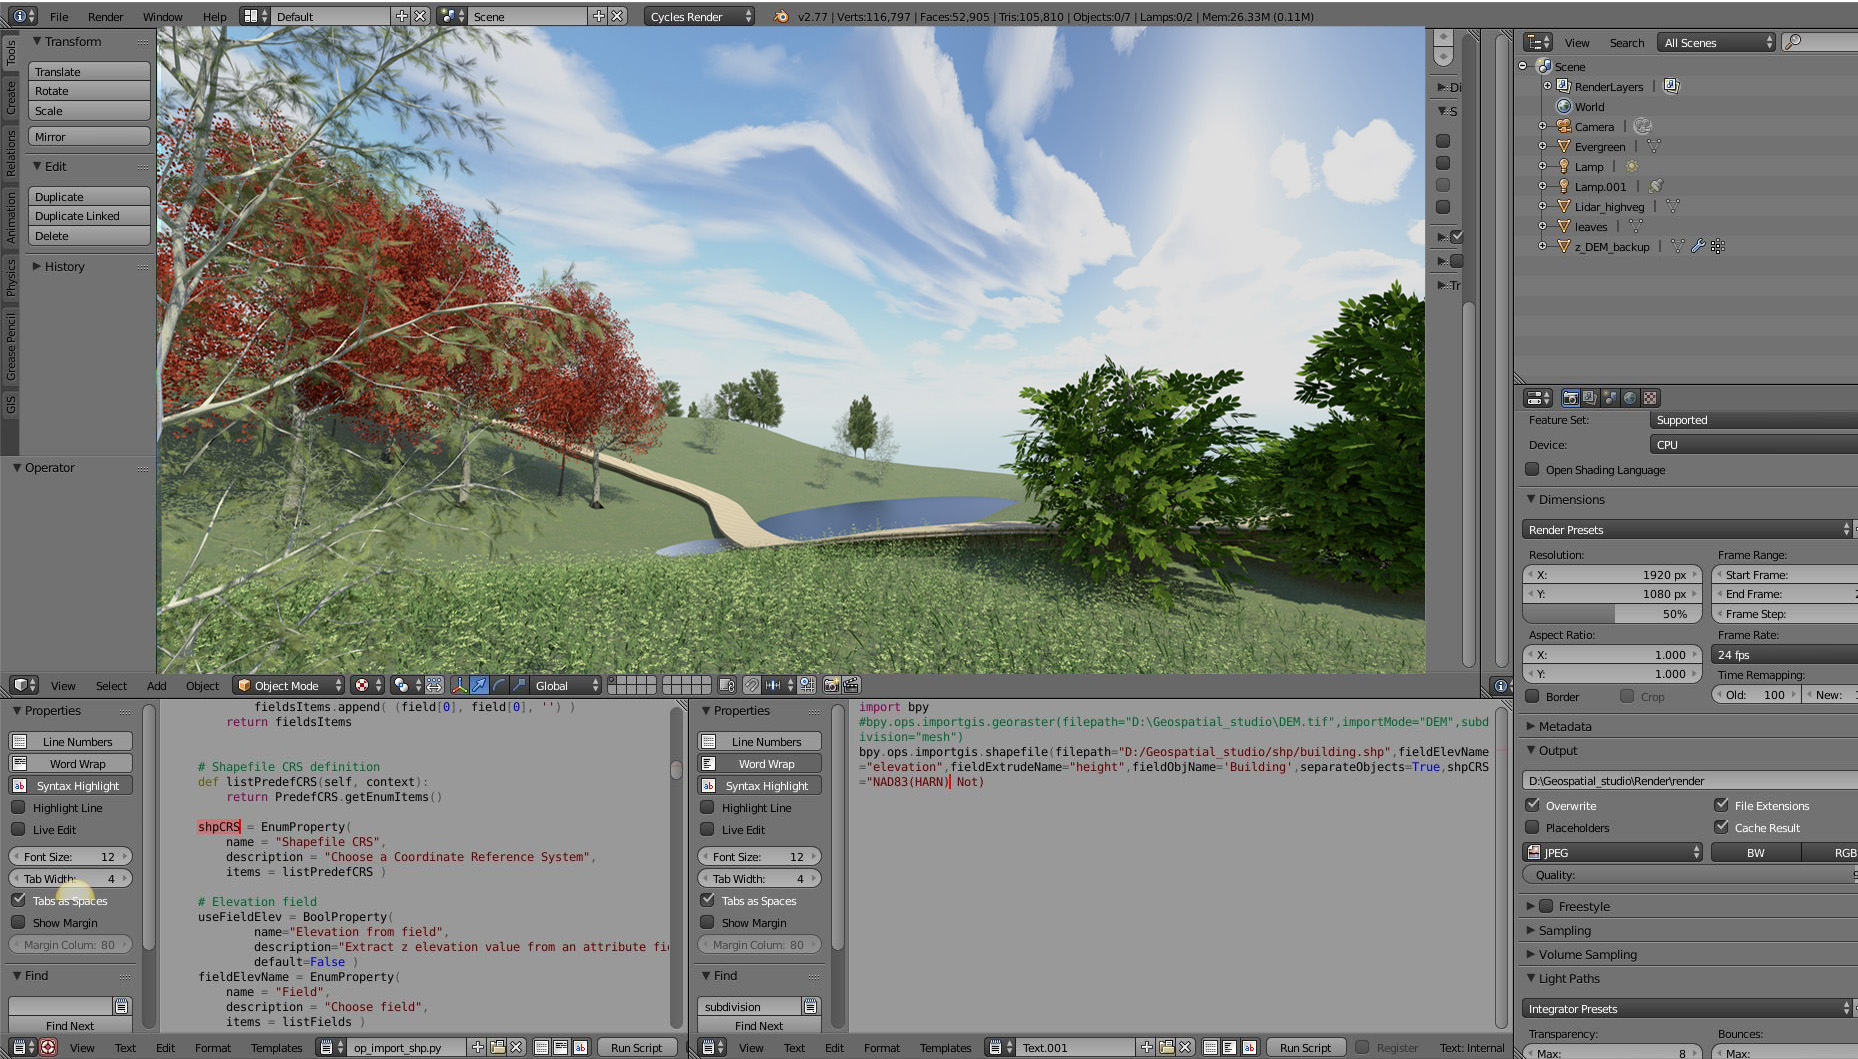
What is Blender? Why Blender?
Free and open source 3d modeling and game engine software
Easy scripting (Python)
GIS and Virtual reality plugin
High-quality real-time rendering and shading
What is Blender? and Why we used Blender?
Blender is a free and open source program for modeling, rendering, simulation, animation, and game design.
The software has an internal python-based IDE and add-ons for importing GIS data to georeference the scene, and displaying the viewport in HMDs.
It also supports realtime high-quality rendering at the viewort with advanced shading options such as ambient occlusion, ambient lightning, anti-aliasing and raytrace shadows.
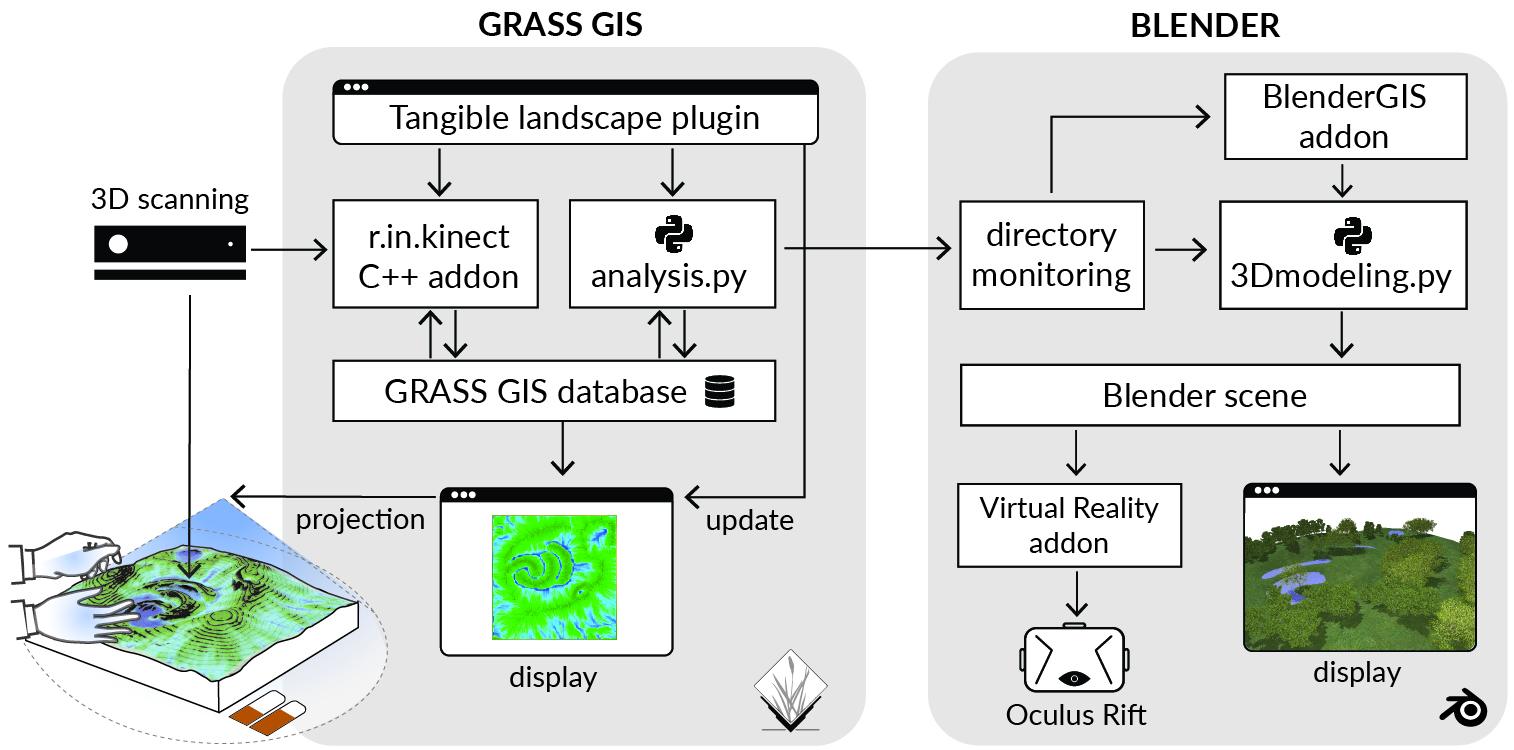
Software Architecture
Briefly describing the workflow, GRASS GIS and Blender are loosely coupled through file-based communication. As user interacts with the tangible model or objects, GRASS GIS sends a copy of the geo-coordinated information or simulation to a specified system directory.
We implemented a monitoring module in blender scripting environment that constantly watches the directory, identifies the type of incoming information, and apply relevant operations needed to update the 3d model. The input data can range from geospatial features like a raster or a point cloud, simple coordinates as a text file, or signals that prompt a command such as removing an object from the scene.
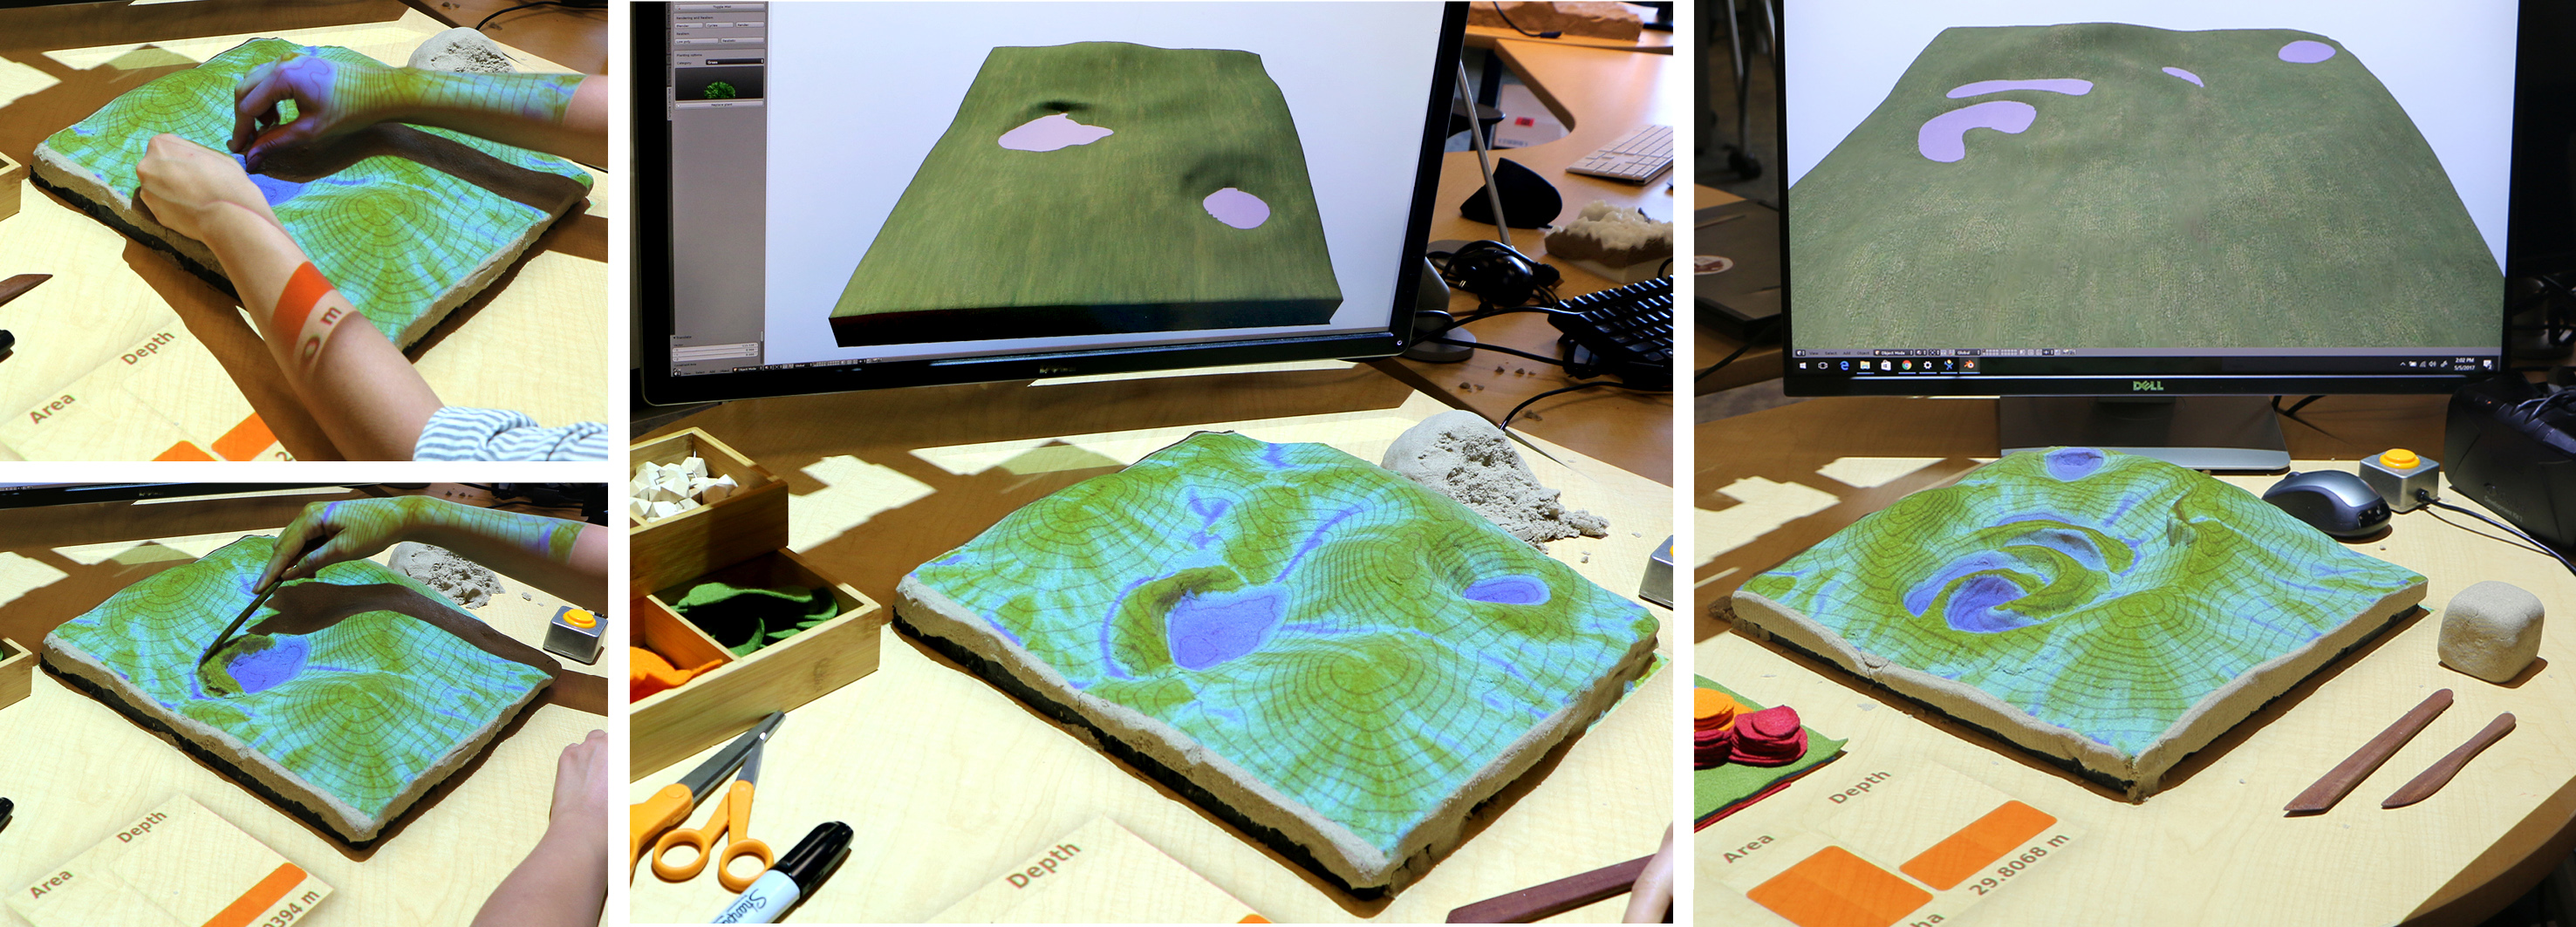
Landform and water bodies
Interaction: hand, sculpting knife
3D processing: terrain GeoTIFF raster and water polygon
Simulation: Water flow (r.sim.water), Ponding (r.fill.dir)
Projection: Water Surface Area, Mean depth
We use a landscape planting use-case to demostrate how some of the geospatial features can be processed and visualized through this workflow.
In the first step user carves the landscape to manage water flow and create artificial pond. As you can Water flow and accumulation simulations are projected onto the physical model
along with numeric feedback about the depth and surface area of the retained water that are projected on the side. At the same time, surface raster and water polygon is transferred to blender to update the 3D model.
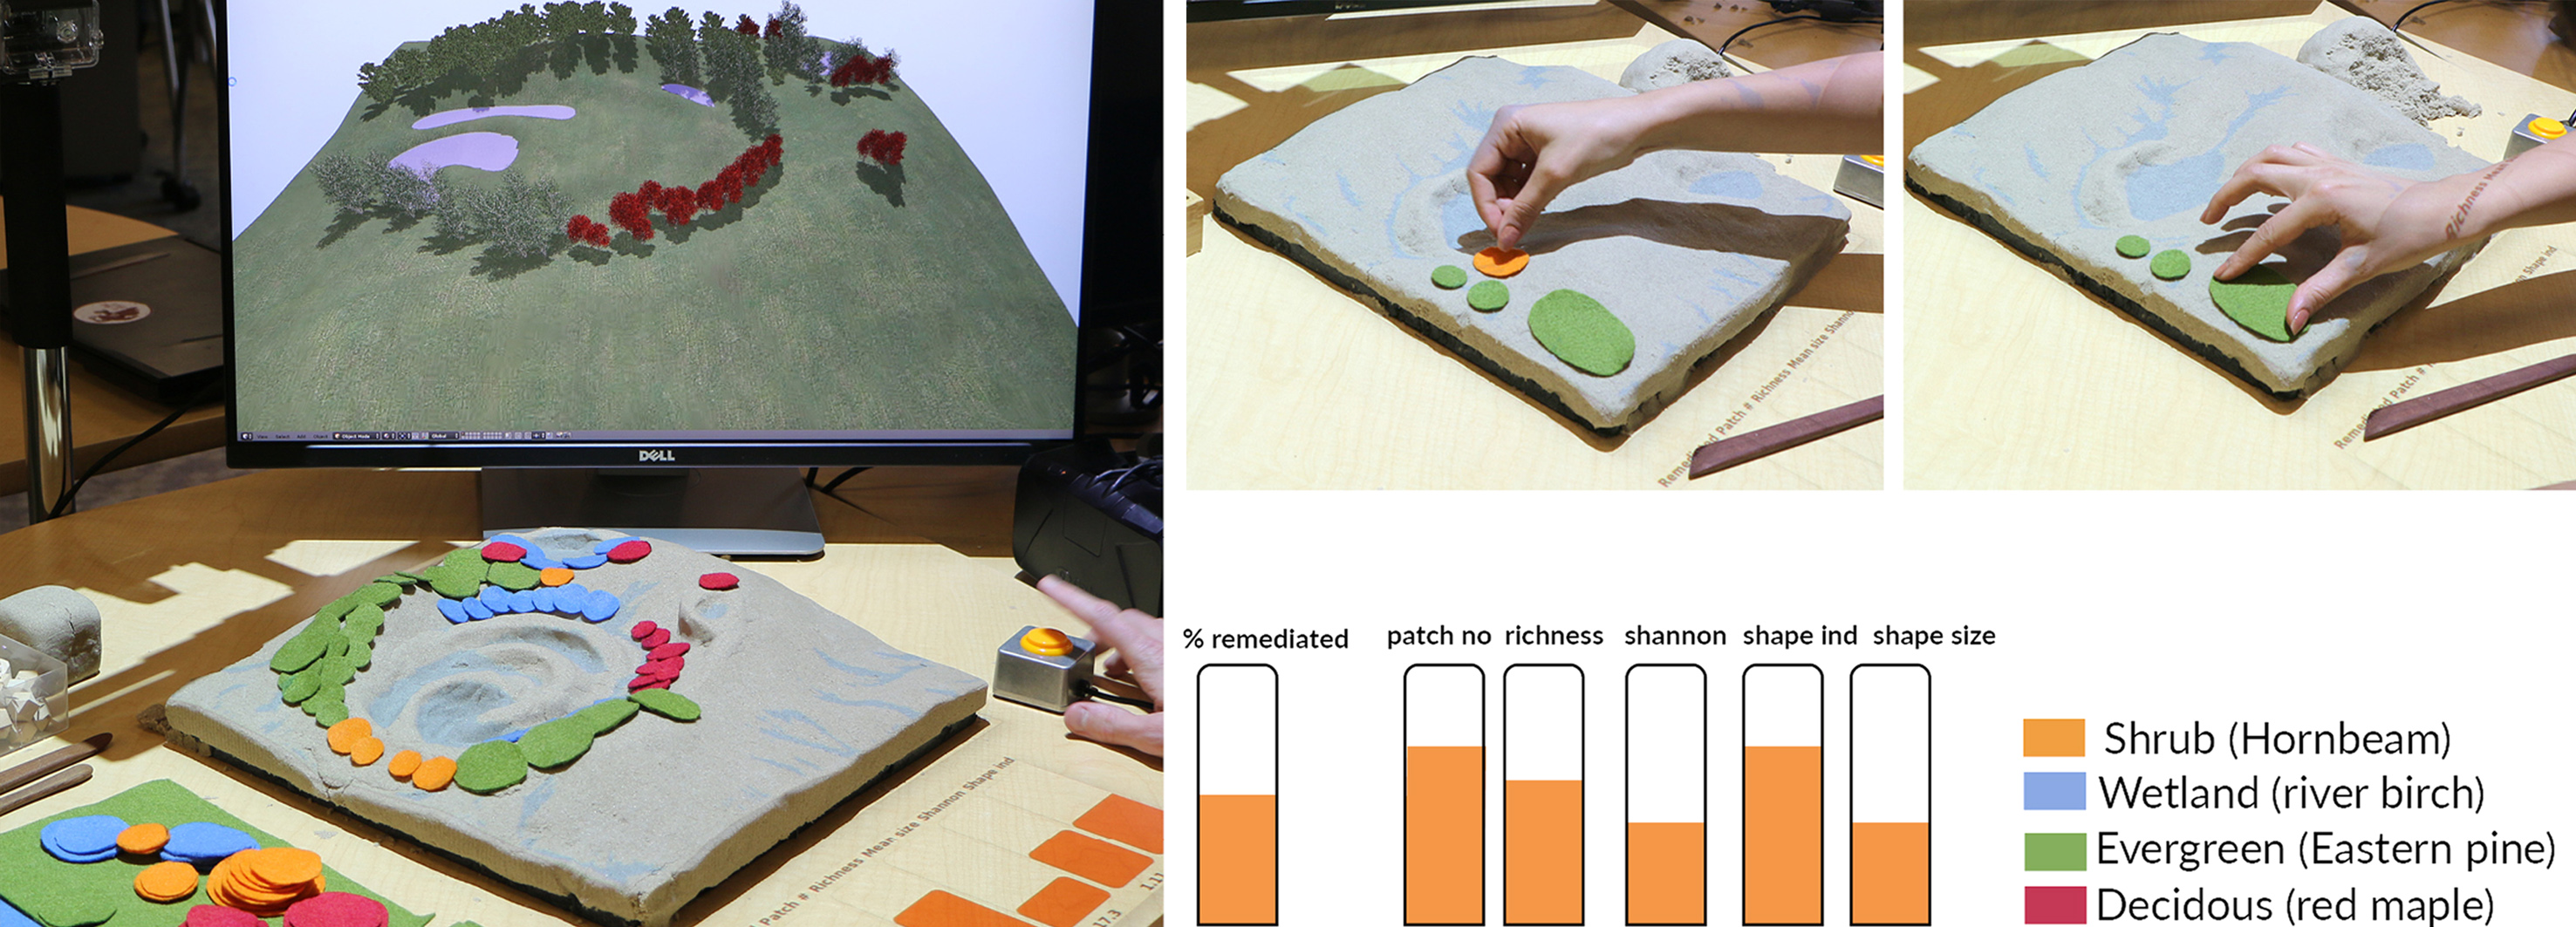
Vegetated surfaces
Interaction: Felt pieces, laser pointer
3D processing: Importing and populating species classes using the plants library
Simulation: Complexity, Heterogeneity, Biodiversity, Remediation capacity, Landscape structure analysis (r.li)
Projection: Percent remediated, No of patches, patch richness, Shannon Diversity,
Users can design tree patches using colored felt pieces.They can either draw and cut their prefered shapes using scissors, or select from a library of preset shapes that we provide them.
Each color represents a landscape class, like decidous, evergreen etc. For instance in this example green denotes eastern pine trees, red dentoes red maple and blue represents river birch. Using pattern recognition and image classification Grass GIS generates a lancover. In this case We applied landscape structure analysis to compute and project various metrics related to landscape compexity and biodiversity
which as you can see is projected below the landscape model. After importing patches Blender script applies a particle system modifier to populate corresponding species with predefined spacing and density.
We lso apply Some degree of randomness to the size, rotation and sucsession of species to mimic their realworld representations.
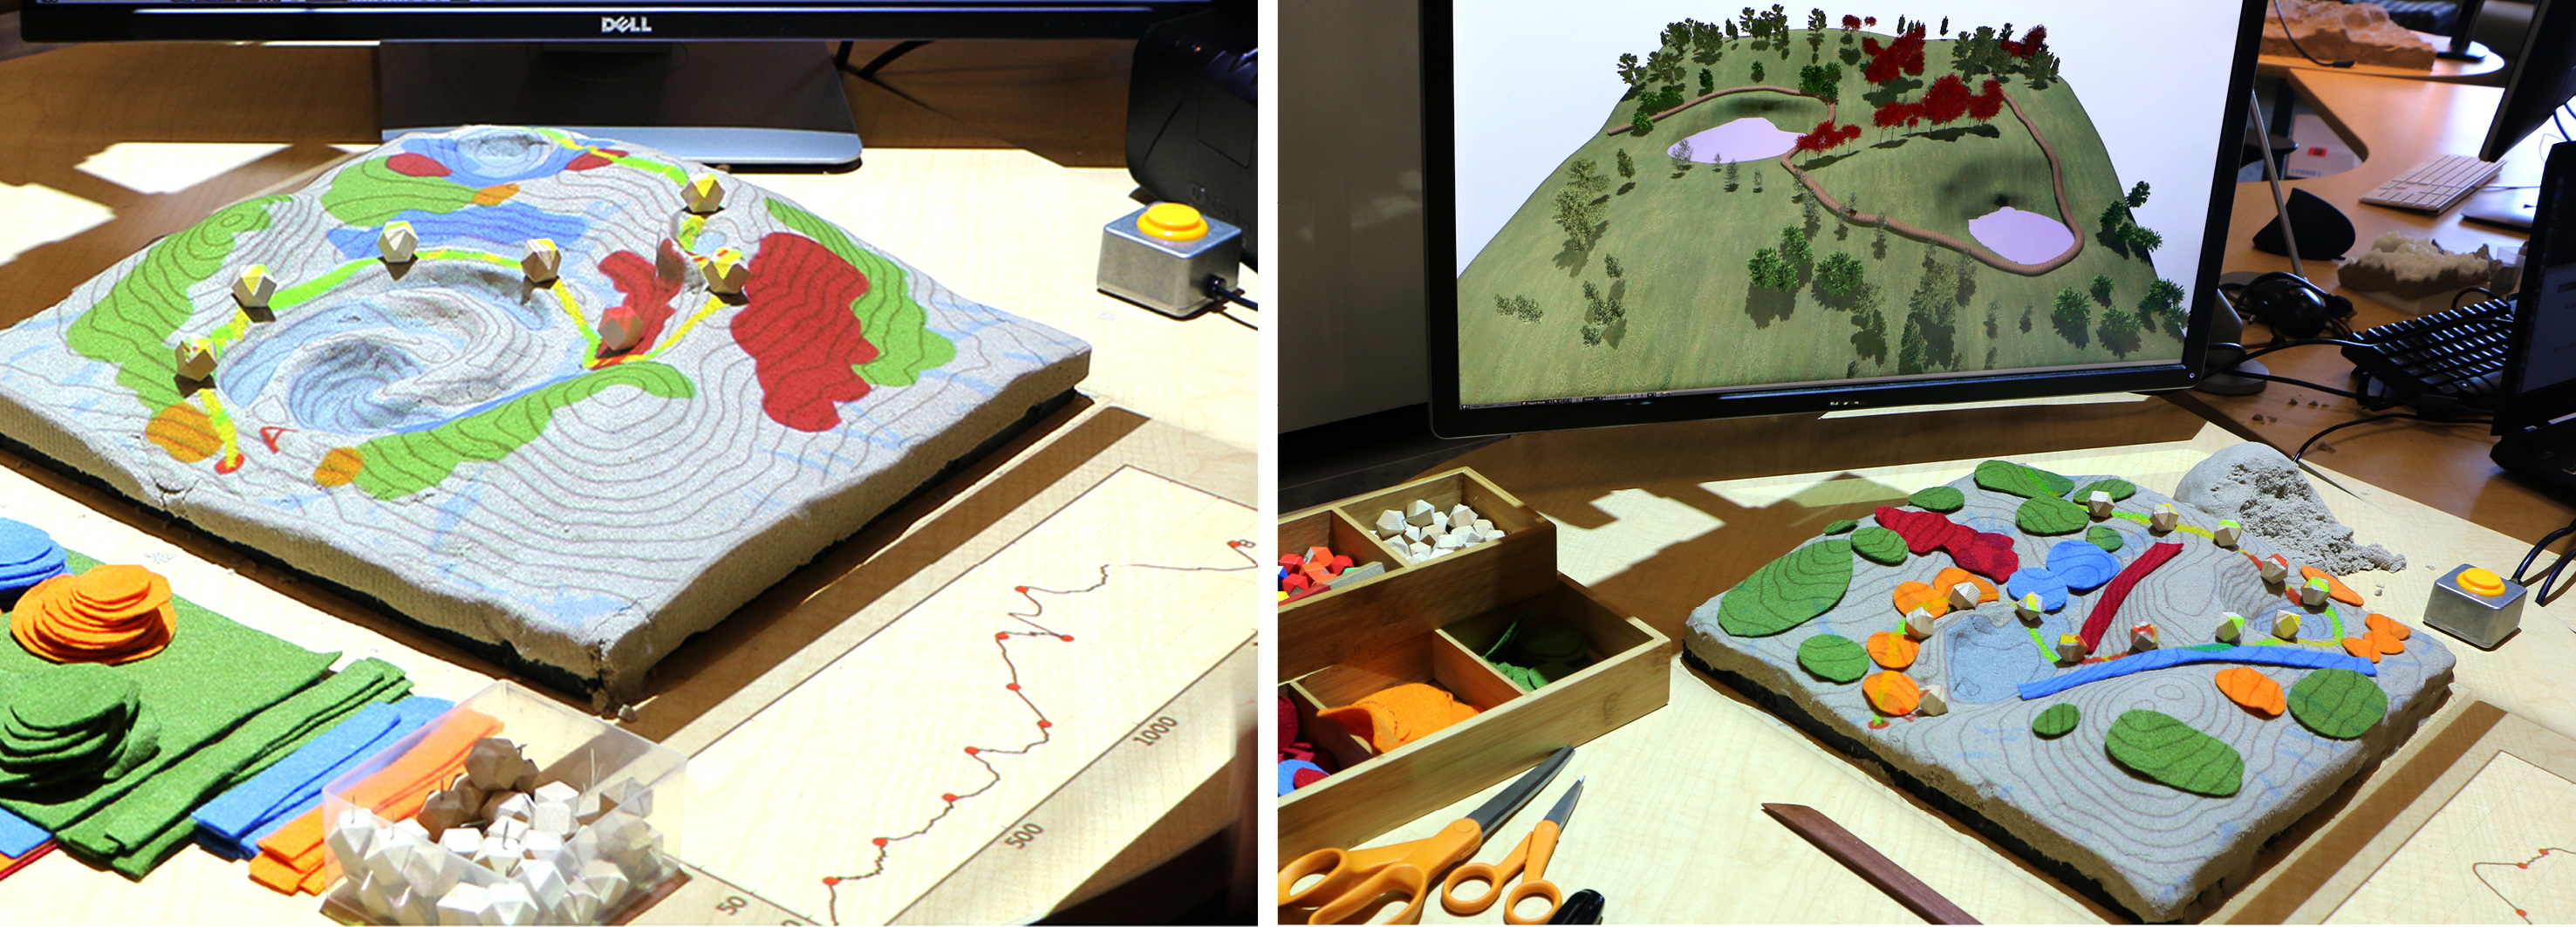
Linear features, trails
Interaction: Wooden markers, Laser pointer
3D processing : Importing polyline shapefiles and extrusion based on patch profile, assigning animation and camera path
Simulation: Traveling salesman (Python heuristic), Least-cost-path analysis (r.walk), Slope analysis
Feedback: Trail profile, slope, least-cost path
(Show the trail and wooden cubes.)
Additionally users can use tangible objects like wooden cubes to designtate a path, in this example baord walks.
As user inserts each of the chekpoints, Grass GIS, recalculates and projects an optimal route using an least cost path algorithm.
A profile of the road and the slope of the segments are projected as feedback (show them).
Additionally, the polyline feature is processed in Blender as a walktrough simulation that can viewed on screen or in HMD.
Human views
Interaction: Wooden marker, Laser pointer
3D processing : Importing polyline shapefiles and extrusion based on patch profile, assigning animation and camera path
Simulation: Viewshed
Feedback: Viewshed area, depth of view, viewdepth variation
The 3D model is interactive so anytime during the interaction users pick up the mouse and freely navigate in the environment.
But we wanted to keep that interaction also tangible. We used wooden marker with a colored tip, that denotes the viewers location and direction of view.
In Blender the camera location and target point is aligned to the imported polyline feature to update the view.
Immersion
Using a virtual reality addon, blender viewport is continuously displayed in both viewport and headmounted display,
so users can pick up the headset and get immersed in their prefered views.
One additional camera is also set to follow the imported trail feature to initiate a walkthrough animation if required.
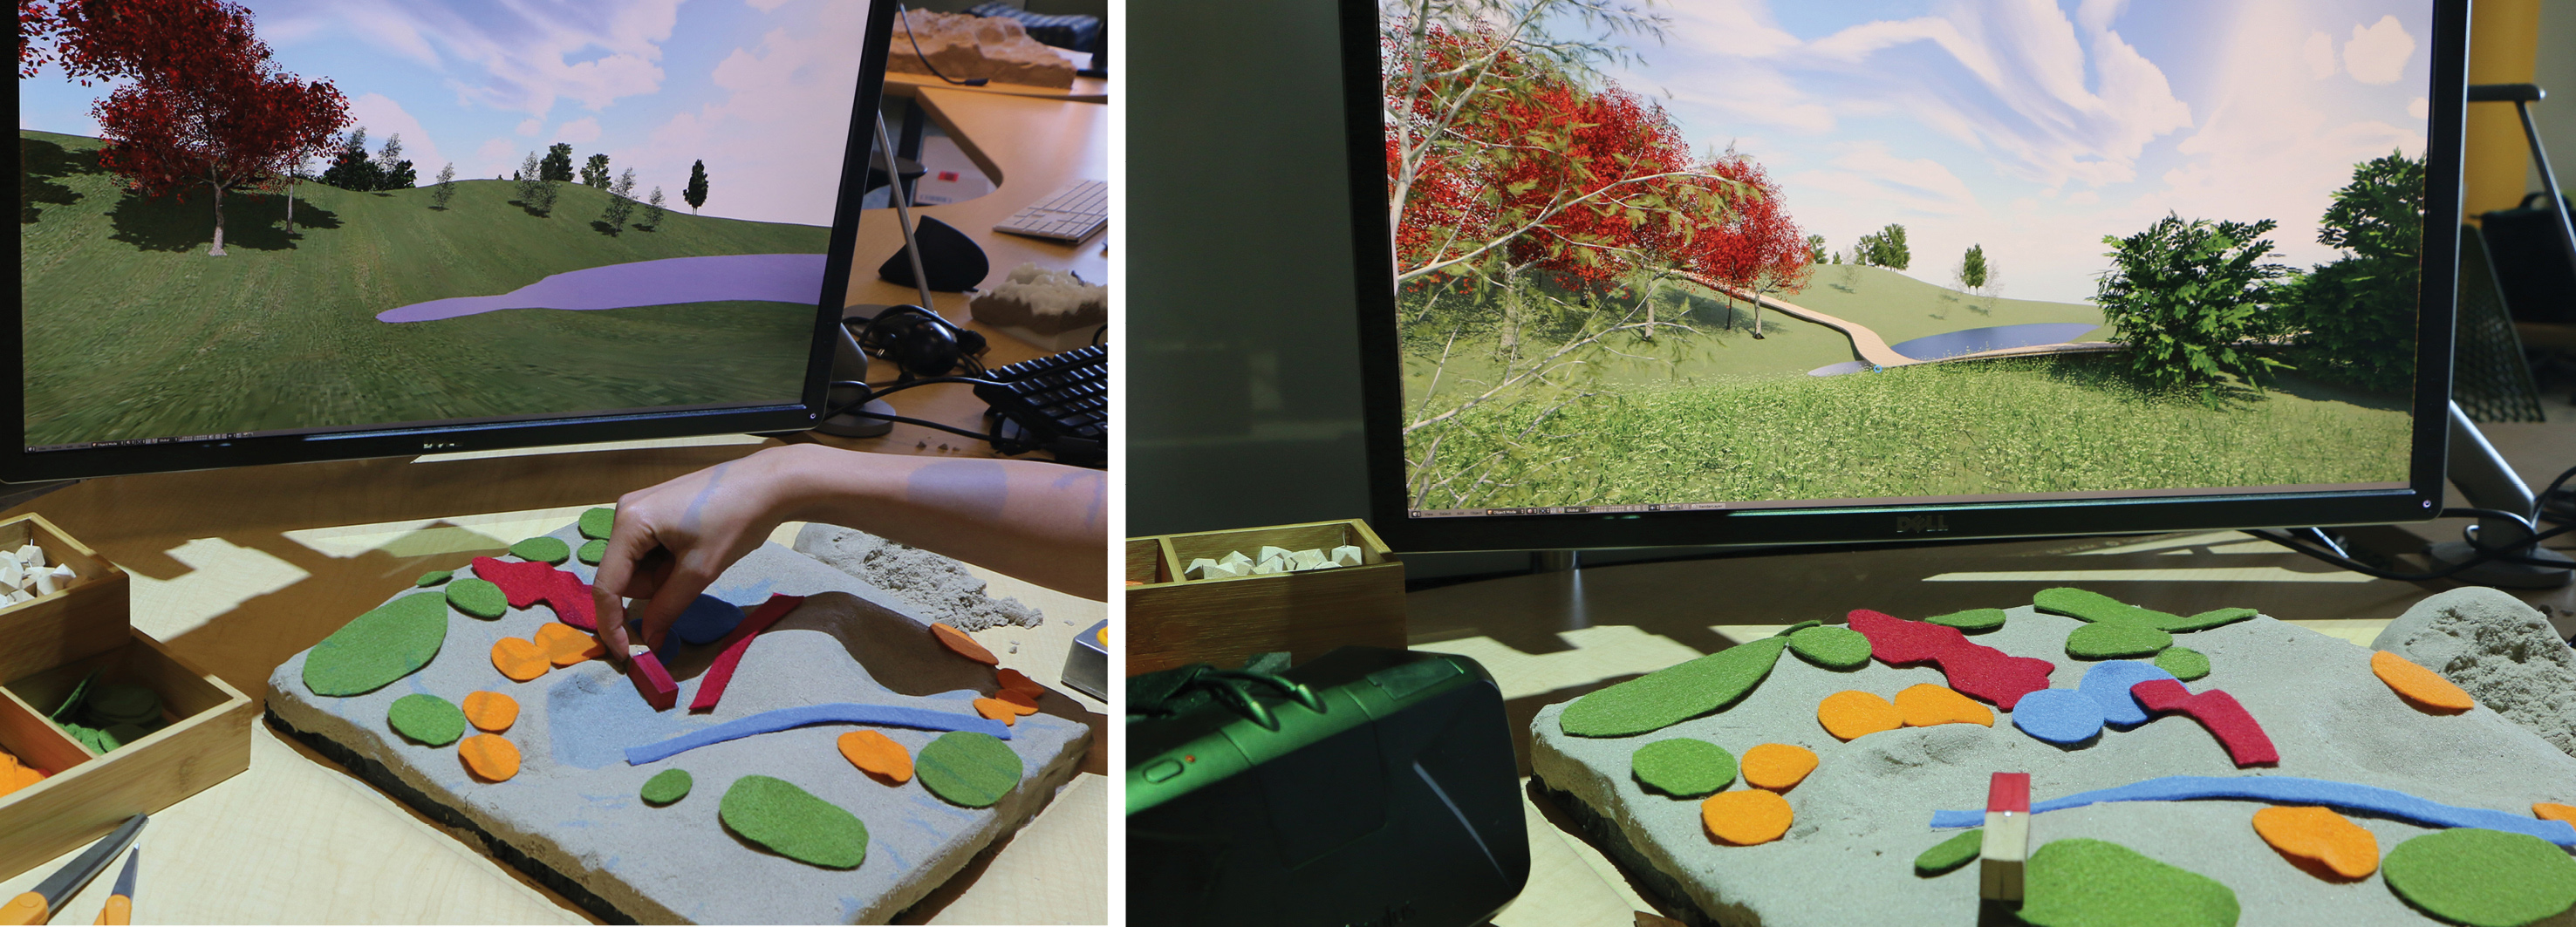
Realism
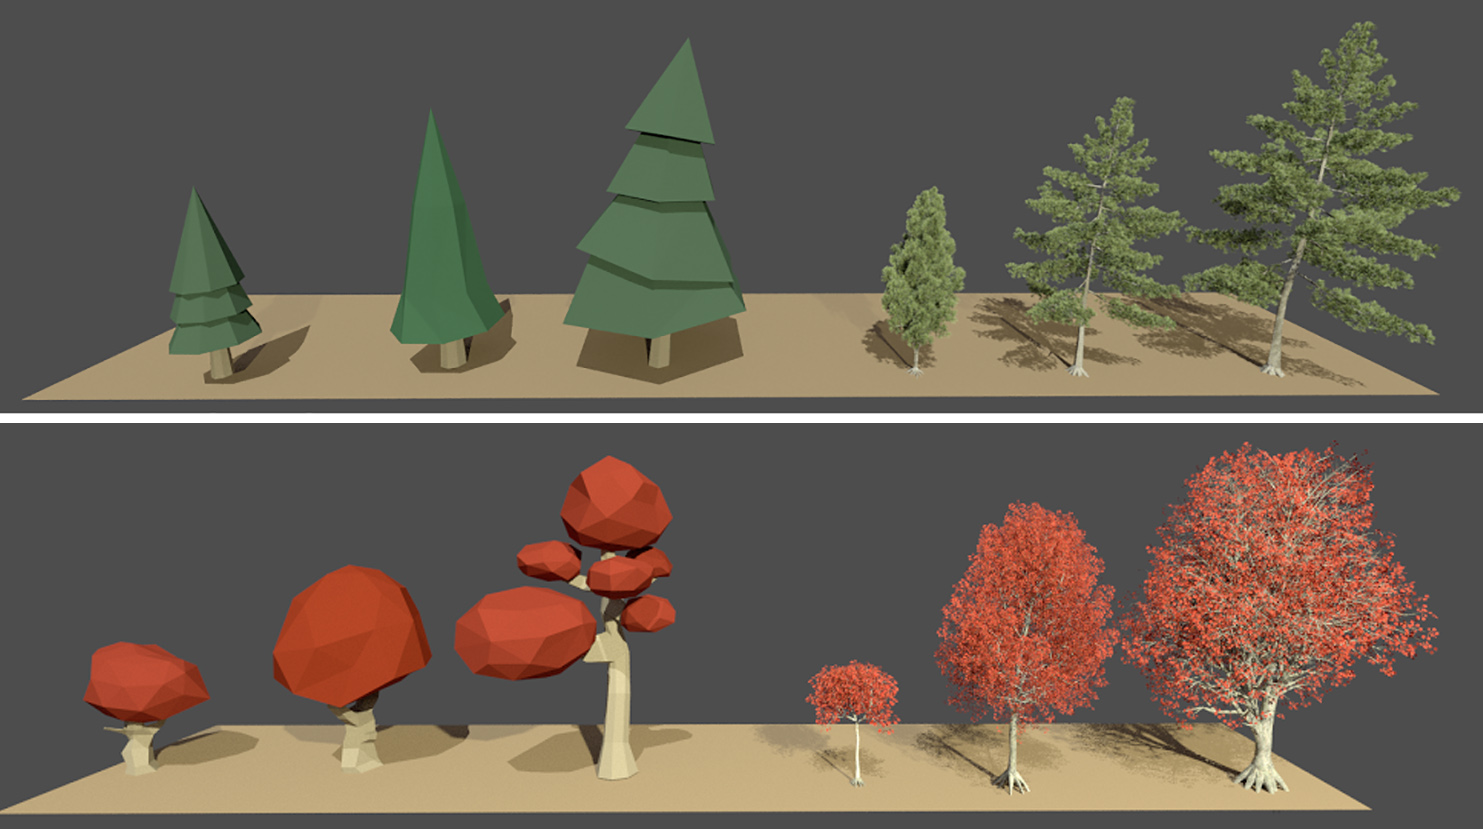
Optionally, we allowed user to manipulate degree of realism. We assigned each 3D feature from the sky to the trees to a low-poly counterpart.
Here you can see three plant age groups both modes.
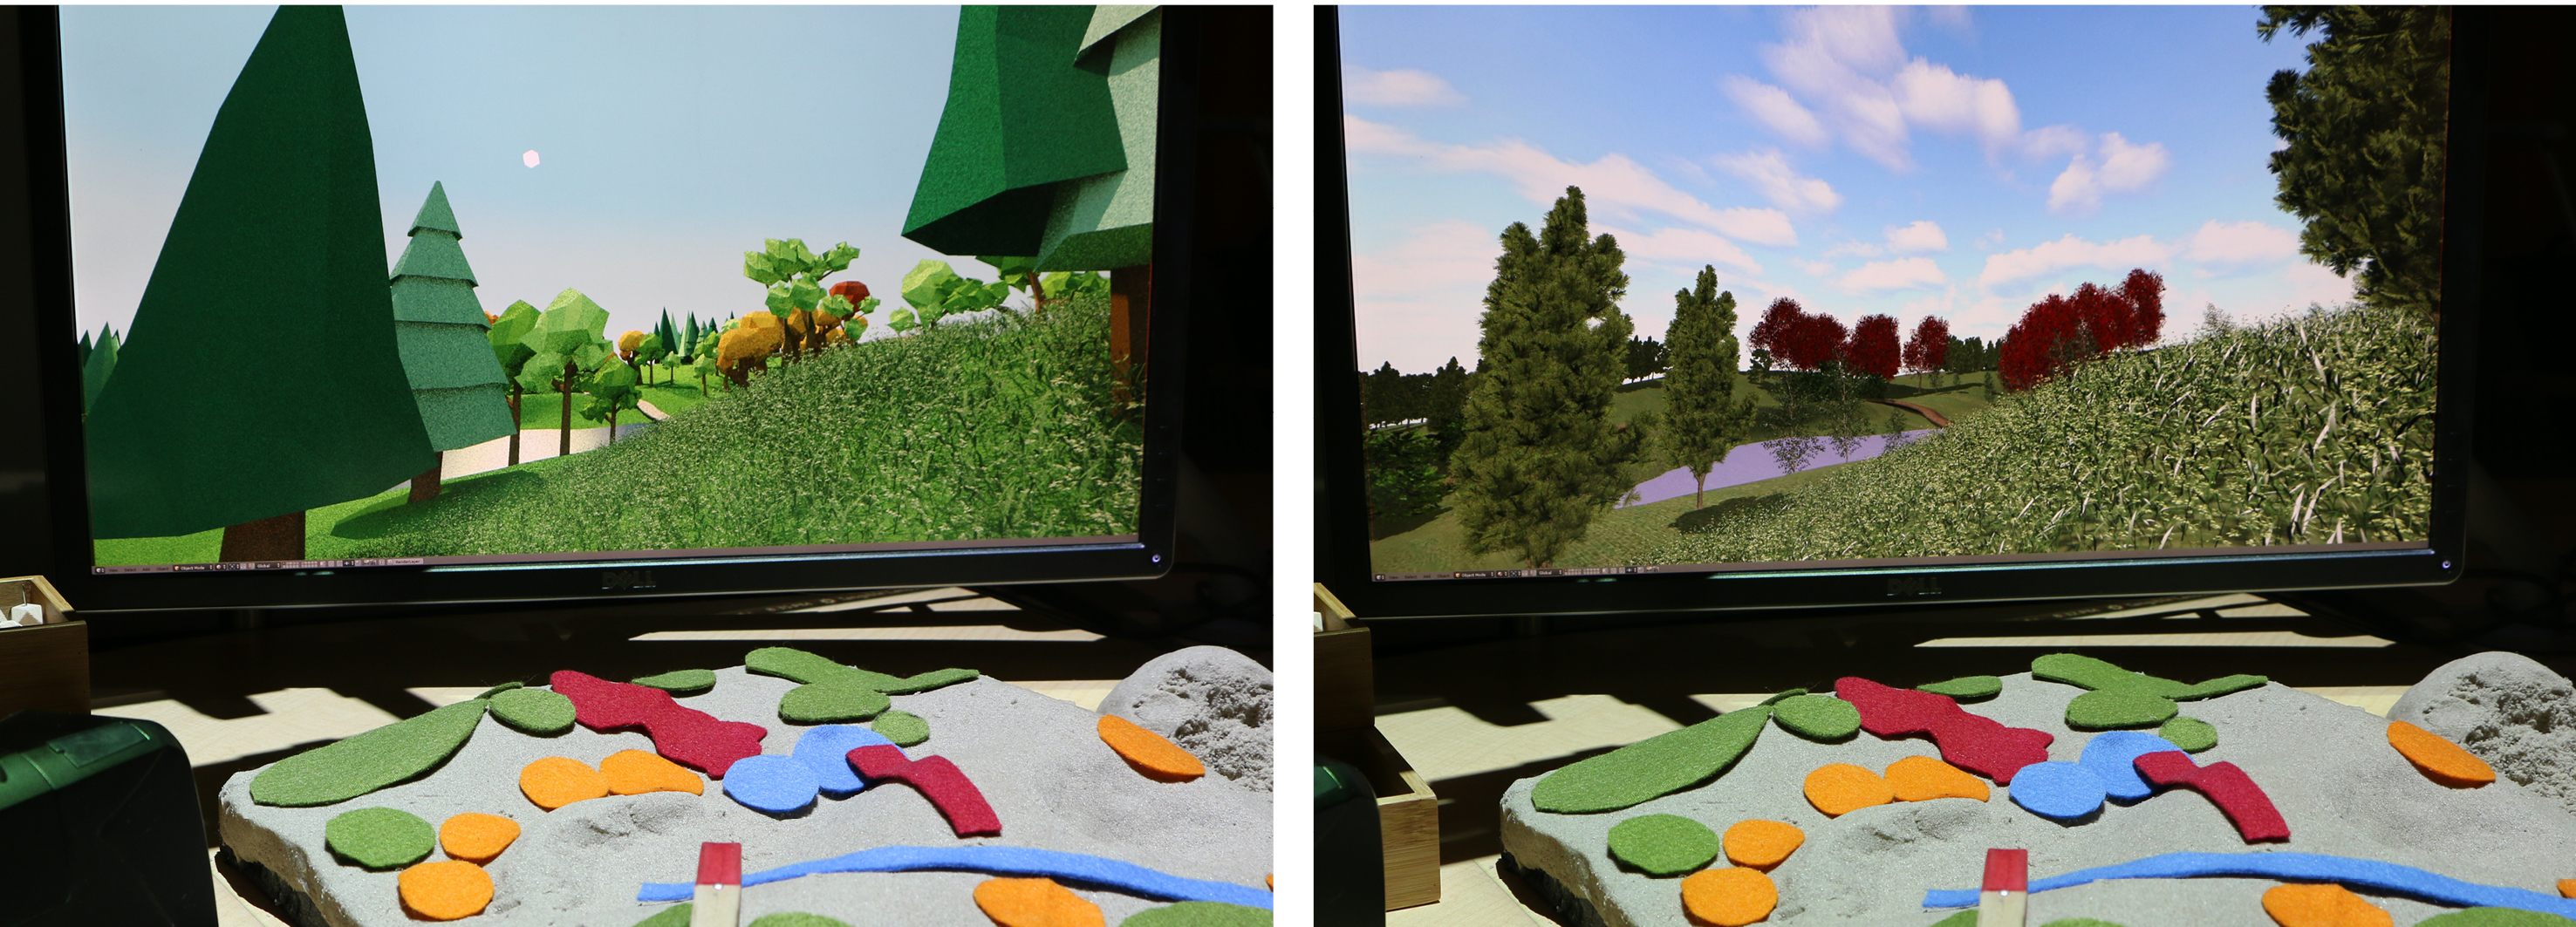
Realism
Abstract (Low-poly) Realistic (viewport shading)
Here you can see realistic and abstract rendering of the same view.
Manipulating realism can be very helpful to manage the scene complexity,
and provides diffrent options to communicate with various age and expertise groups.
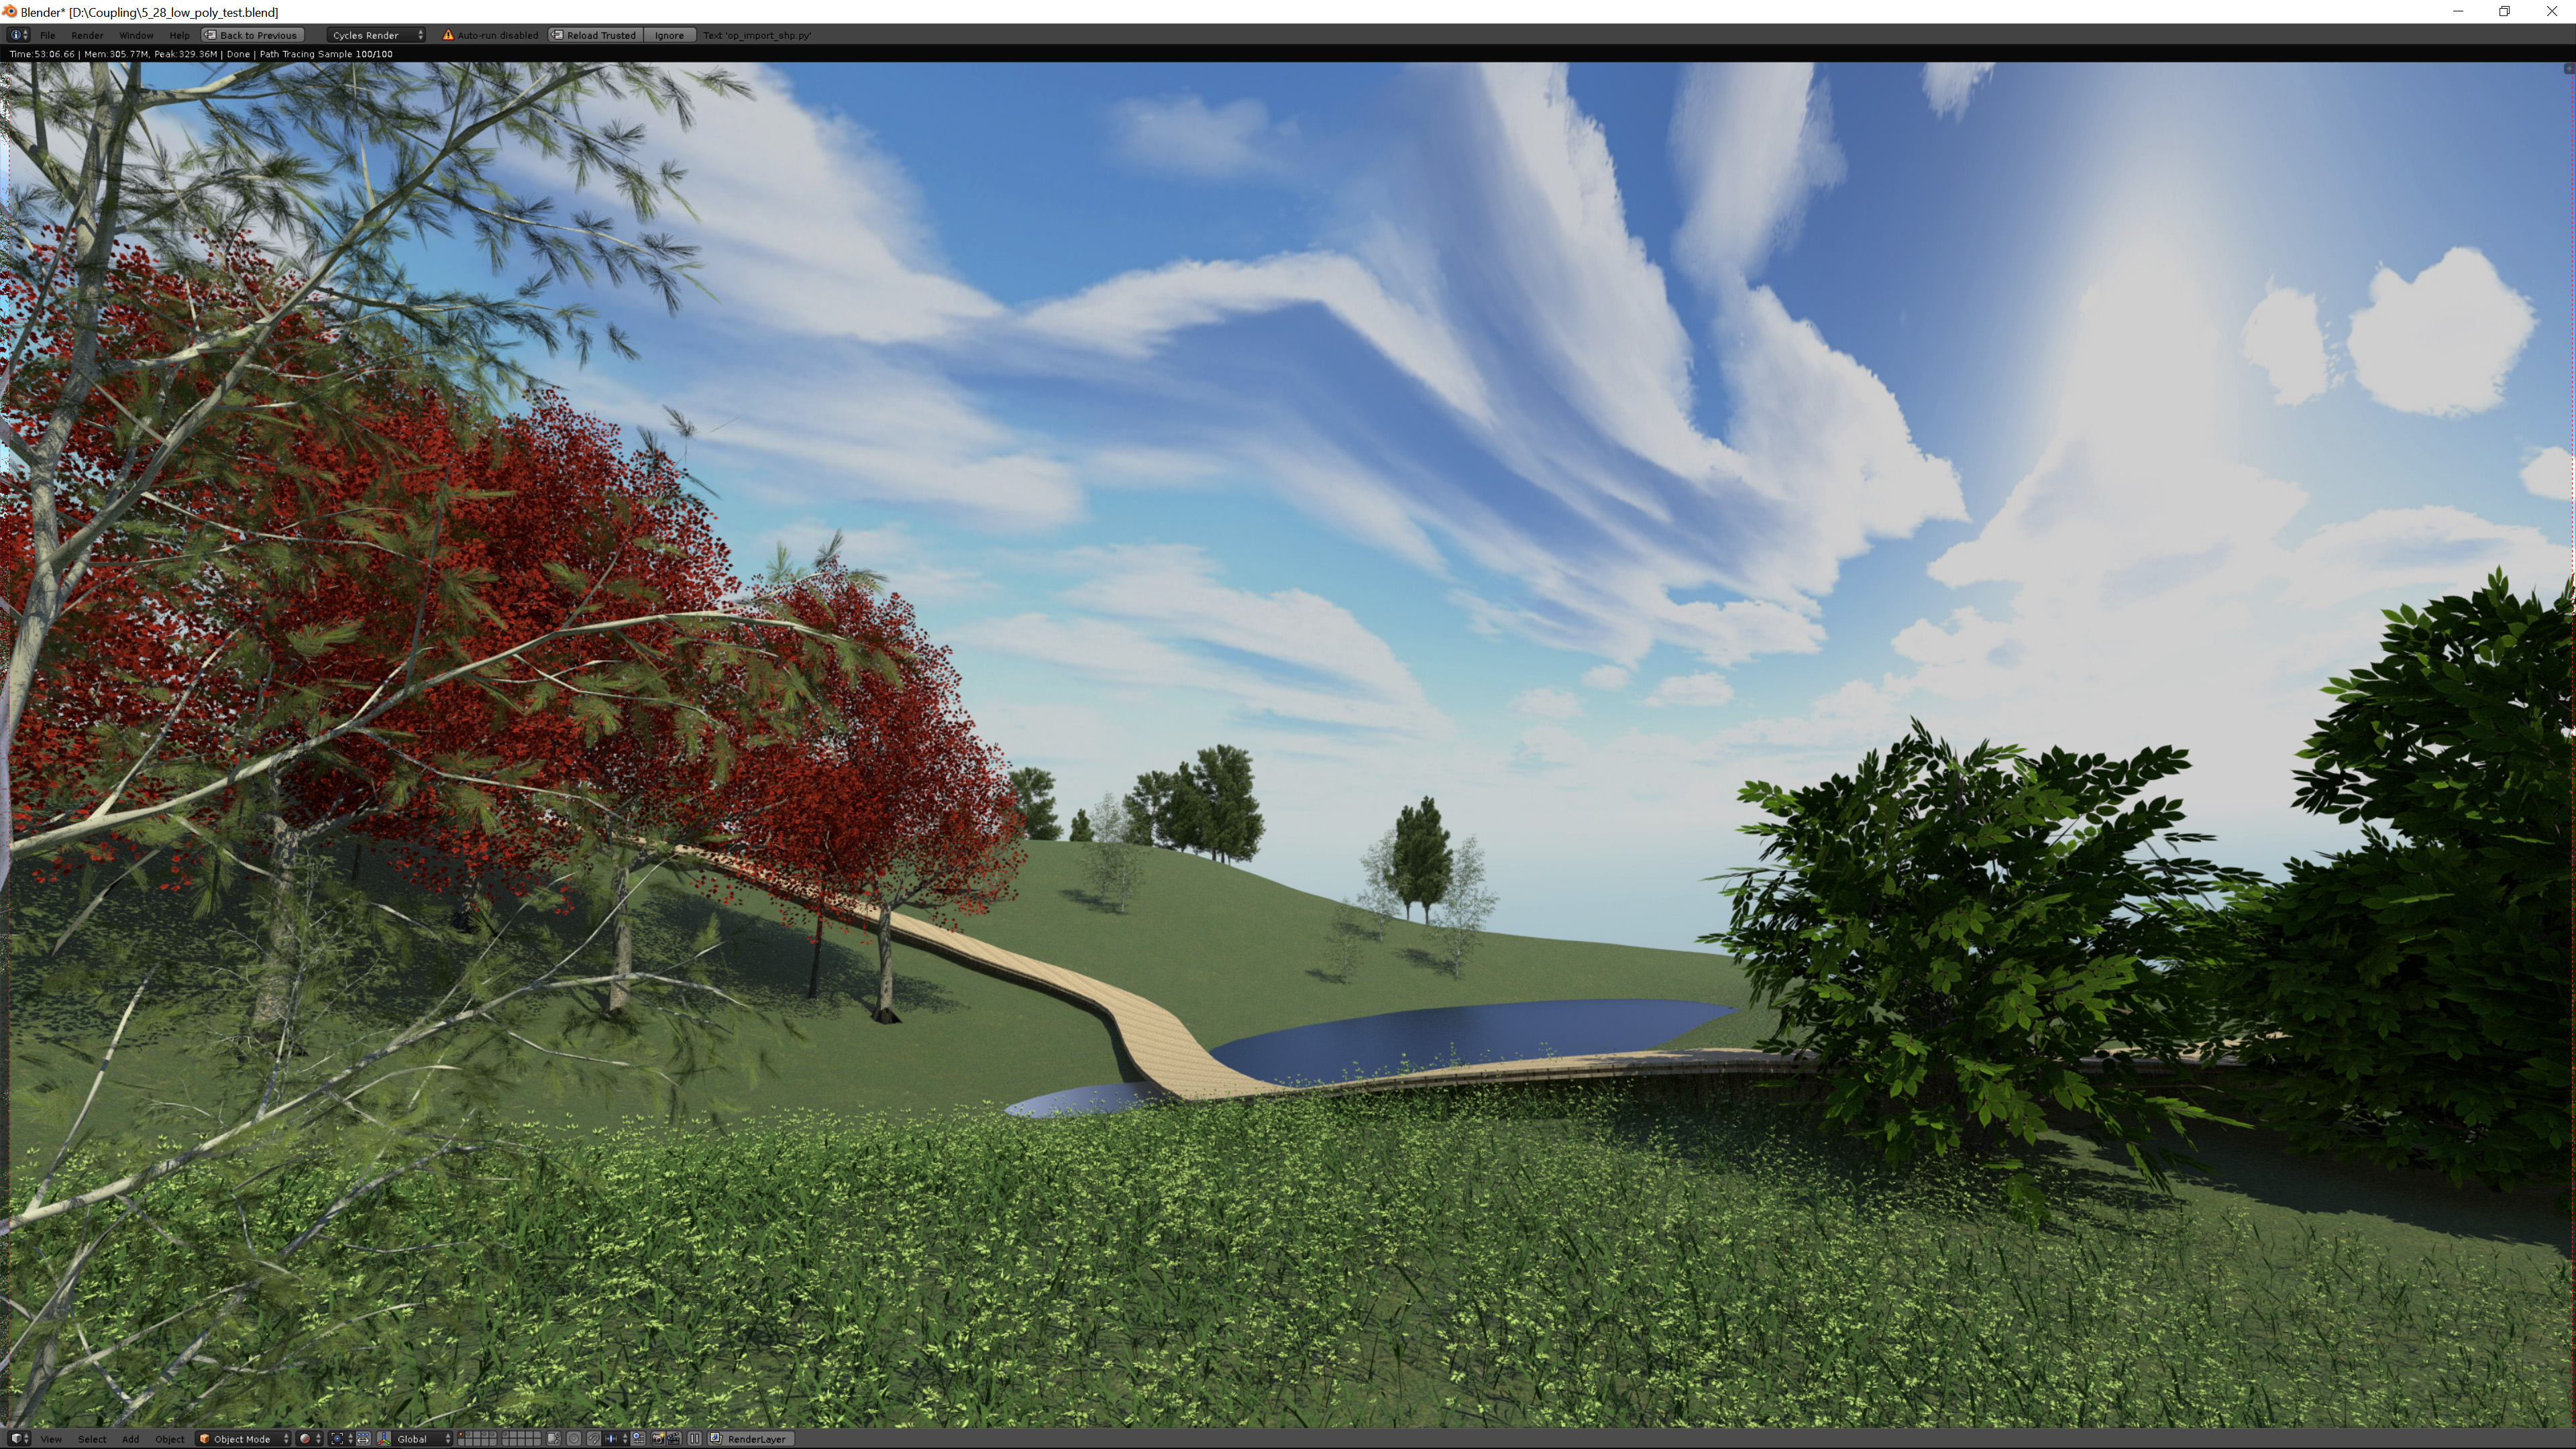
Even more realistic
Render engine: Cycles GPU Rendering time: 1 min 100 samples
To gain even higher realism user can switch to cycles render that produces a much higher resolutions and rendering qality for as an end product.
This obviously adds to the rendering time. For example, rendering this scene with 100 light samples took aroud a minute.
Future work
User studies (creativity, problems solving, decision-making, collaboration, participation)
Completing the features library (plant species, urban features)
Research application
While we are constantly working to upgrade the features, our first objective is to conduct user studies.
Currently we are collaborating with a psychologist to design experiments to test the effectiveness of the system on creativity, problem solving and learning.
Specially, we are very curious to see how this application can help collaborative decision making and trade-off assessment that is how stakeholders, designers and scientists
can collaboratively work together to find win-win situations between ecologic and experiential aspects of understudy landscape.
Resources
If you are interested to learn more about Tangible landscape, These are some useful resources that can get you started.
While I am taking the questions, you can look at this video to see how an ecological scientist and designer work together to design a landscape.
Through the design process, please note that how the developments enables the dialogue between ecological assessment and aesthetic evaluation.