# import standard Python packages
import os
import sys
import subprocess
import json
from io import StringIO
from pathlib import Path

%reload_ext autoreload
%autoreload 2
# Visulization packages
import pandas as pd
import geopandas as gpd
import seaborn as snsGRASS v8.5 (Preview)
- GRASS GIS is a Geospatial Processing Engine
- Open Source (GPL v2)
- Developed by International and Multi-institutional groups and individuals (GRASS Development Team)
- Member of the Open Source Geospatial Foundatispace
- Recieved Open Source Security Foundation (OpenSSF) Best Practices Badge - 2024
Modern Tooling
- Jupyter Notebooks
- GRASS GIS Python API
- Actinia REST API
- Easy intergration with other Data Science tools in Python and R ecosystem
Community
- Active community of users and developers
- Mailing lists, chat, and forums
- Conferences and workshops
- Documentation and tutorials
- Mentoring and outreach programs
Leader in Open Science
- Open Access
- Community Mantaince and Support
- Reproducible Research
- Citations
Setup Environment
Import python packages and set up the GRASS GIS environment.
sys.path.append(
    subprocess.check_output(["grass", "--config", "python_path"], text=True).strip()
)
# import GRASS GIS python packages
%reload_ext autoreload
%autoreload 2
import grass.script as gs
import grass.jupyter as gj# create a temporary folder where to place our GRASS project
import tempfile
tempdir = tempfile.TemporaryDirectory()
print(tempdir.name)/tmp/tmpnp2dcvk3Area of Interest
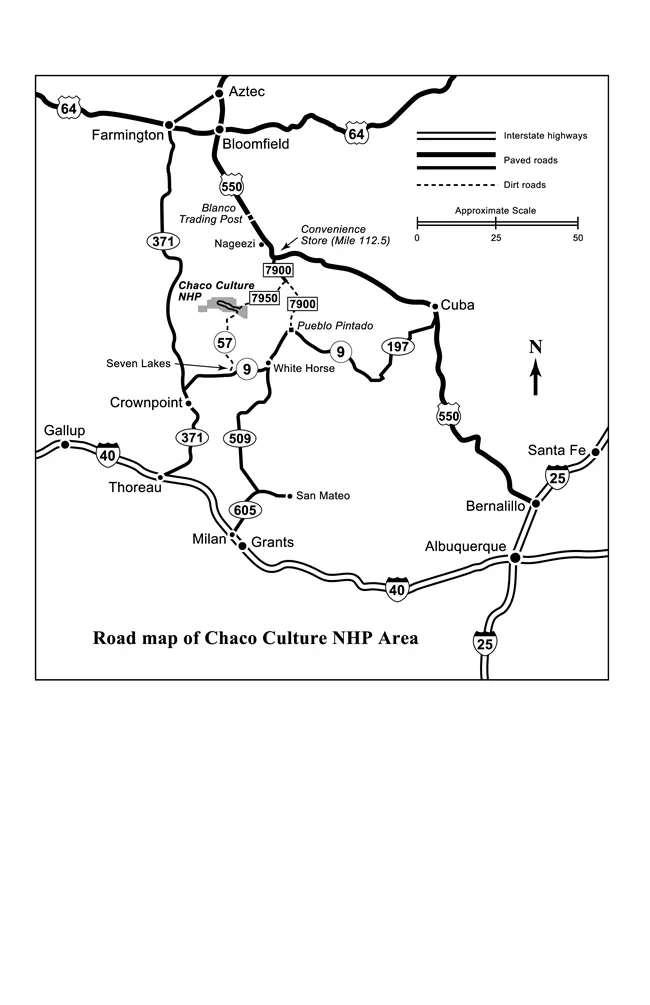
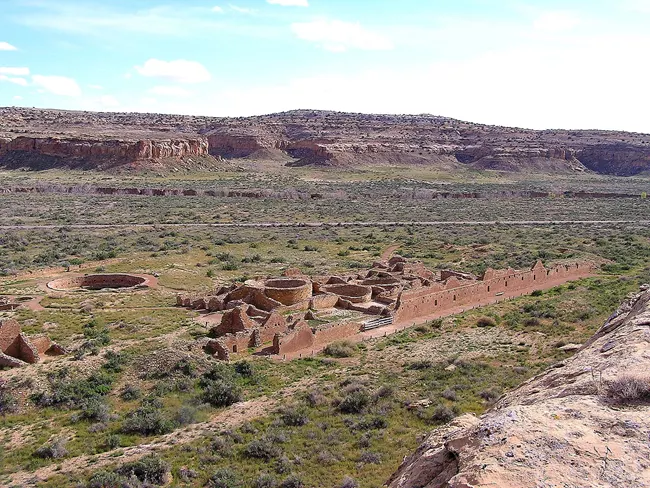
Chaco Cultural National Historical Park
The full dataset is available through OpenTopography
Data Summary
- Funding: National Science Foundation (NSF) Earth Sciences (EAR) Instrumentation and Facilities (IF) Program
- Partner: University of New Mexico
- Collector: National Center for Airborne Laser Mapping (NCALM)
Data Characteristics
- Area 542.72 km^2
- Over 13 Billion Points
- Point Density 25.56 pts/m^2
Raster Resolution 0.5 m
Coordinate System: Horizontal: NAD83 (2011) (EPOCH:2010) / UTM Zone 13N Meters [EPSG: 6342] Vertical: NAVD88 [EPSG: 5703]
Units: Meters
Complete metadata can be found at: OpenTopography
Dorshow, W. (2019). 3D Landscape Reconstruction and Land Use Modeling, Chaco Canyon, NM 2016. National Center for Airborne Laser Mapping (NCALM). Distributed by OpenTopography. https://doi.org/10.5069/G9XG9P8D.. Accessed: 2024-08-19
Download Data
The data used in this tutorial is available through GitHub.
Visualize the point cloud
from IPython.display import IFrame

# URL of the website to be embedded
url = 'https://ot-process2.sdsc.edu/potree/index.html?t=%5B233574.5,3994716,2188.5%5D&p=%5B234704.19367662142,3993579.3112938125,2825.660091521463%5D&r=%22https://ot-process2.sdsc.edu/appEntwineEPTService1724096588005642548939/pc1724096516919%22&m=9&era=%5B1858,2519%5D'
# Dimensions of the IFrame
width = 800
height = 600
# Display the IFrame in the notebook
IFrame(url, width=width, height=height)
GRASS Project Setup
Create a new project in GRASS for Chaco Culture National Historical Park
gs.create_project(path=tempdir.name, name="ChacoCanyon2016", epsg="6342", overwrite=True)# start GRASS in the recently created project
session = gj.init(Path(tempdir.name,"ChacoCanyon2016"))Download Add-ons
GRASS GIS Addons Over 400 add-ons available!
Let’s download the add-ons for the project.
with open("extensions.txt", "r") as f:
    lines = f.readlines()
    for line in lines:
        line = line.strip()
        print(f"Installing: {line}")
        gs.run_command("g.extension", extension=line, operation="add")
Prepare Data
Let’s examine point cloud data first with pdal before importing into GRASS GIS.
!pdal info --summary metadata/points2.laz{
"file_size": 18912844,
"filename": "metadata/points2.laz",
"now": "2024-08-22T17:20:40-0400",
"pdal_version": "2.3.0 (git-version: Release)",
"reader": "readers.las",
"summary":
{
"bounds":
{
"maxx": 229974.27,
"maxy": 3997397.29,
"maxz": 2030.95,
"minx": 229377.17,
"miny": 3996851.14,
"minz": 1846.72
},
"dimensions": "X, Y, Z, Intensity, ReturnNumber, NumberOfReturns, ScanDirectionFlag, EdgeOfFlightLine, Classification, ScanAngleRank, UserData, PointSourceId, GpsTime, ScanChannel, ClassFlags",
"num_points": 9017333,
"srs":
{
"compoundwkt": "COMPD_CS[\"NAD83(2011) / UTM zone 13N + NAVD88 height\",PROJCS[\"NAD83(2011) / UTM zone 13N\",GEOGCS[\"NAD83(2011)\",DATUM[\"NAD83_National_Spatial_Reference_System_2011\",SPHEROID[\"GRS 1980\",6378137,298.257222101,AUTHORITY[\"EPSG\",\"7019\"]],AUTHORITY[\"EPSG\",\"1116\"]],PRIMEM[\"Greenwich\",0,AUTHORITY[\"EPSG\",\"8901\"]],UNIT[\"degree\",0.0174532925199433,AUTHORITY[\"EPSG\",\"9122\"]],AUTHORITY[\"EPSG\",\"6318\"]],PROJECTION[\"Transverse_Mercator\"],PARAMETER[\"latitude_of_origin\",0],PARAMETER[\"central_meridian\",-105],PARAMETER[\"scale_factor\",0.9996],PARAMETER[\"false_easting\",500000],PARAMETER[\"false_northing\",0],UNIT[\"metre\",1,AUTHORITY[\"EPSG\",\"9001\"]],AXIS[\"Easting\",EAST],AXIS[\"Northing\",NORTH],AUTHORITY[\"EPSG\",\"6342\"]],VERT_CS[\"NAVD88 height\",VERT_DATUM[\"North American Vertical Datum 1988\",2005,AUTHORITY[\"EPSG\",\"5103\"]],UNIT[\"metre\",1,AUTHORITY[\"EPSG\",\"9001\"]],AXIS[\"Gravity-related height\",UP],AUTHORITY[\"EPSG\",\"5703\"]]]",
"horizontal": "PROJCS[\"NAD83(2011) / UTM zone 13N\",GEOGCS[\"NAD83(2011)\",DATUM[\"NAD83_National_Spatial_Reference_System_2011\",SPHEROID[\"GRS 1980\",6378137,298.257222101,AUTHORITY[\"EPSG\",\"7019\"]],AUTHORITY[\"EPSG\",\"1116\"]],PRIMEM[\"Greenwich\",0,AUTHORITY[\"EPSG\",\"8901\"]],UNIT[\"degree\",0.0174532925199433,AUTHORITY[\"EPSG\",\"9122\"]],AUTHORITY[\"EPSG\",\"6318\"]],PROJECTION[\"Transverse_Mercator\"],PARAMETER[\"latitude_of_origin\",0],PARAMETER[\"central_meridian\",-105],PARAMETER[\"scale_factor\",0.9996],PARAMETER[\"false_easting\",500000],PARAMETER[\"false_northing\",0],UNIT[\"metre\",1,AUTHORITY[\"EPSG\",\"9001\"]],AXIS[\"Easting\",EAST],AXIS[\"Northing\",NORTH],AUTHORITY[\"EPSG\",\"6342\"]]",
"isgeocentric": false,
"isgeographic": false,
"prettycompoundwkt": "COMPD_CS[\"NAD83(2011) / UTM zone 13N + NAVD88 height\",\n PROJCS[\"NAD83(2011) / UTM zone 13N\",\n GEOGCS[\"NAD83(2011)\",\n DATUM[\"NAD83_National_Spatial_Reference_System_2011\",\n SPHEROID[\"GRS 1980\",6378137,298.257222101,\n AUTHORITY[\"EPSG\",\"7019\"]],\n AUTHORITY[\"EPSG\",\"1116\"]],\n PRIMEM[\"Greenwich\",0,\n AUTHORITY[\"EPSG\",\"8901\"]],\n UNIT[\"degree\",0.0174532925199433,\n AUTHORITY[\"EPSG\",\"9122\"]],\n AUTHORITY[\"EPSG\",\"6318\"]],\n PROJECTION[\"Transverse_Mercator\"],\n PARAMETER[\"latitude_of_origin\",0],\n PARAMETER[\"central_meridian\",-105],\n PARAMETER[\"scale_factor\",0.9996],\n PARAMETER[\"false_easting\",500000],\n PARAMETER[\"false_northing\",0],\n UNIT[\"metre\",1,\n AUTHORITY[\"EPSG\",\"9001\"]],\n AXIS[\"Easting\",EAST],\n AXIS[\"Northing\",NORTH],\n AUTHORITY[\"EPSG\",\"6342\"]],\n VERT_CS[\"NAVD88 height\",\n VERT_DATUM[\"North American Vertical Datum 1988\",2005,\n AUTHORITY[\"EPSG\",\"5103\"]],\n UNIT[\"metre\",1,\n AUTHORITY[\"EPSG\",\"9001\"]],\n AXIS[\"Gravity-related height\",UP],\n AUTHORITY[\"EPSG\",\"5703\"]]]",
"prettywkt": "PROJCS[\"NAD83(2011) / UTM zone 13N\",\n GEOGCS[\"NAD83(2011)\",\n DATUM[\"NAD83_National_Spatial_Reference_System_2011\",\n SPHEROID[\"GRS 1980\",6378137,298.257222101,\n AUTHORITY[\"EPSG\",\"7019\"]],\n AUTHORITY[\"EPSG\",\"1116\"]],\n PRIMEM[\"Greenwich\",0,\n AUTHORITY[\"EPSG\",\"8901\"]],\n UNIT[\"degree\",0.0174532925199433,\n AUTHORITY[\"EPSG\",\"9122\"]],\n AUTHORITY[\"EPSG\",\"6318\"]],\n PROJECTION[\"Transverse_Mercator\"],\n PARAMETER[\"latitude_of_origin\",0],\n PARAMETER[\"central_meridian\",-105],\n PARAMETER[\"scale_factor\",0.9996],\n PARAMETER[\"false_easting\",500000],\n PARAMETER[\"false_northing\",0],\n UNIT[\"metre\",1,\n AUTHORITY[\"EPSG\",\"9001\"]],\n AXIS[\"Easting\",EAST],\n AXIS[\"Northing\",NORTH],\n AUTHORITY[\"EPSG\",\"6342\"]]",
"proj4": "+proj=utm +zone=13 +ellps=GRS80 +towgs84=0,0,0,0,0,0,0 +units=m +vunits=m +no_defs",
"units":
{
"horizontal": "metre",
"vertical": "metre"
},
"vertical": "VERT_CS[\"NAVD88 height\",VERT_DATUM[\"North American Vertical Datum 1988\",2005,AUTHORITY[\"EPSG\",\"5103\"]],UNIT[\"metre\",1,AUTHORITY[\"EPSG\",\"9001\"]],AXIS[\"Gravity-related height\",UP],AUTHORITY[\"EPSG\",\"5703\"]]",
"wkt": "PROJCS[\"NAD83(2011) / UTM zone 13N\",GEOGCS[\"NAD83(2011)\",DATUM[\"NAD83_National_Spatial_Reference_System_2011\",SPHEROID[\"GRS 1980\",6378137,298.257222101,AUTHORITY[\"EPSG\",\"7019\"]],AUTHORITY[\"EPSG\",\"1116\"]],PRIMEM[\"Greenwich\",0,AUTHORITY[\"EPSG\",\"8901\"]],UNIT[\"degree\",0.0174532925199433,AUTHORITY[\"EPSG\",\"9122\"]],AUTHORITY[\"EPSG\",\"6318\"]],PROJECTION[\"Transverse_Mercator\"],PARAMETER[\"latitude_of_origin\",0],PARAMETER[\"central_meridian\",-105],PARAMETER[\"scale_factor\",0.9996],PARAMETER[\"false_easting\",500000],PARAMETER[\"false_northing\",0],UNIT[\"metre\",1,AUTHORITY[\"EPSG\",\"9001\"]],AXIS[\"Easting\",EAST],AXIS[\"Northing\",NORTH],AUTHORITY[\"EPSG\",\"6342\"]]"
}
}
}Remove Outliers from Point Cloud
!pdal pipeline pdal/preprocessing.jsonImport Data into GRASS GIS
Let’s calculate the point density of the point cloud data at 1m resolution.
gs.run_command('r.in.pdal',
            input='metadata/points2_clean.laz',
            output='points_n',
            method='n', # Count number of points per cell
            resolution=1, # 1 meter
            flags="ewn",
            overwrite=True)
Visulalize the Raster Data
gs.run_command("r.colors", map="points_n", color="bcyr", flags="e")
m = gj.Map()
m.d_rast(map="points_n")
m.d_legend(raster="points_n", at=(5, 10, 50, 90), flags="b")
m.d_barscale(at=(5, 6), flags="n")
m.show()
points_n_info = gs.parse_command('r.info', map='points_n', format="json")
points_n_df = pd.DataFrame(points_n_info)

points_n_df.head(1)| north | south | nsres | east | west | ewres | rows | cols | cells | datatype | ... | creator | title | timestamp | units | vdatum | semantic_label | source1 | source2 | description | comments | |
|---|---|---|---|---|---|---|---|---|---|---|---|---|---|---|---|---|---|---|---|---|---|
| 0 | 3997398 | 3996851 | 1 | 229975 | 229377 | 1 | 547 | 598 | 327106 | CELL | ... | coreywhite | Raw X,Y,Z data binned into a raster grid by ce... | None | None | None | None | metadata/points2_clean.laz | generated by r.in.pdal | r.in.pdal --overwrite -w -e -n input="metadata... |
1 rows × 30 columns
Histograms of Raster Data
hist = gj.Map()
hist.d_histogram(map="points_n", flags="c")
hist.show()
univar_json = gs.parse_command('r.univar', map='points_n', format="json")
univar_df = pd.DataFrame(univar_json)
univar_df.head()| n | null_cells | cells | min | max | range | mean | mean_of_abs | stddev | variance | coeff_var | sum | |
|---|---|---|---|---|---|---|---|---|---|---|---|---|
| 0 | 327106 | 0 | 327106 | 0 | 135 | 135 | 27.567006 | 27.567006 | 8.416197 | 70.832372 | 30.529964 | 9017333 |
gs.run_command('r.in.pdal',
            input='metadata/points2_clean.laz',
            output='points_median',
            method='median', # median of the z values
            resolution=1, # meter
            flags="ewn",
            overwrite=True)

gs.run_command("r.colors", map="points_median", color="elevation", flags="")
m = gj.Map()

m.d_rast(map="points_median")
m.d_legend(raster="points_median", at=(60, 95, 85, 90), flags="bd")
m.d_barscale(at=(5, 6), flags="n")
m.show()
Now let’s look at the histograms of the median elevation.
hist = gj.Map()
hist.d_histogram(map="points_median")
hist.show()
univar_json = gs.parse_command('r.univar', map='points_median', format="json", flags="e")
univar_df = pd.DataFrame(univar_json)
univar_df.head()| n | null_cells | cells | min | max | range | mean | mean_of_abs | stddev | variance | coeff_var | sum | first_quartile | median | third_quartile | percentiles | |
|---|---|---|---|---|---|---|---|---|---|---|---|---|---|---|---|---|
| 0 | 327090 | 16 | 327106 | 1846.920044 | 1918.099976 | 71.179932 | 1896.1288 | 1896.1288 | 17.64089 | 311.200993 | 0.930363 | 6.202048e+08 | 1889.959961 | 1902.719971 | 1908.689941 | [{'percentile': 90, 'value': 1911.6400146484375}] |
def spatial_resolution_analysis():
    output_maps = []
    for i in [0.5, 1, 3, 5, 10]:
        output_map = f'points_{i}m_mean'
        gs.run_command('r.in.pdal',
                input='metadata/points2_clean.laz',
                output=output_map,
                method='mean', # mean of the z values
                resolution=i, # meter
                flags="ewn",
                overwrite=True)
        univar_json = gs.parse_command('r.univar', map=output_map, format="json", flags="e")
        univar_json[0]['resolution'] = i
        output_maps.append(univar_json[0])

    return pd.DataFrame(output_maps)

mean_univar_df = spatial_resolution_analysis()
mean_univar_df.set_index('resolution', inplace=True)
mean_univar_df.head(5)| n | null_cells | cells | min | max | range | mean | mean_of_abs | stddev | variance | coeff_var | sum | first_quartile | median | third_quartile | percentiles | |
|---|---|---|---|---|---|---|---|---|---|---|---|---|---|---|---|---|
| resolution | ||||||||||||||||
| 0.5 | 1298570 | 7565 | 1306135 | 1846.883301 | 1962.815796 | 115.932495 | 1896.145970 | 1896.145970 | 17.622542 | 310.554003 | 0.929387 | 2.462278e+09 | 1889.972046 | 1902.729980 | 1908.694946 | [{'percentile': 90, 'value': 1911.6434326171875}] |
| 1.0 | 327090 | 16 | 327106 | 1846.941772 | 1926.239624 | 79.297852 | 1896.130754 | 1896.130754 | 17.641135 | 311.209630 | 0.930375 | 6.202054e+08 | 1889.958130 | 1902.725830 | 1908.695435 | [{'percentile': 90, 'value': 1911.6436767578125}] |
| 3.0 | 36599 | 1 | 36600 | 1847.095459 | 1917.331787 | 70.236328 | 1896.056648 | 1896.056648 | 17.732032 | 314.424974 | 0.935206 | 6.939378e+07 | 1889.824585 | 1902.695557 | 1908.697388 | [{'percentile': 90, 'value': 1911.6749267578125}] |
| 5.0 | 13200 | 0 | 13200 | 1847.404785 | 1917.161377 | 69.756592 | 1896.171552 | 1896.171552 | 17.628175 | 310.752564 | 0.929672 | 2.502946e+07 | 1890.059448 | 1902.774170 | 1908.708374 | [{'percentile': 90, 'value': 1911.650634765625}] |
| 10.0 | 3355 | 0 | 3355 | 1847.787354 | 1916.982178 | 69.194824 | 1895.952356 | 1895.952356 | 17.820593 | 317.573521 | 0.939928 | 6.360920e+06 | 1889.712280 | 1902.729980 | 1908.641113 | [{'percentile': 90, 'value': 1911.5826416015625}] |
import seaborn as sns
import matplotlib.pyplot as plt
sns.set_theme(style="darkgrid")

# Example plot: scatter plot of mean vs. resolution
# Adjust the column names according to your DataFrame structure
plt.figure(figsize=(10, 6))
sns.scatterplot(data=mean_univar_df, x='resolution', y='mean')

# Add titles and labels
plt.title('Mean Value vs. Resolution')
plt.xlabel('Resolution (m)')
plt.ylabel('Mean Value')

# Show the plot
plt.show()
Now let’s reset our computational region to run our analysis.
gs.run_command("g.region", raster="points_median", flags="pa")projection: 1 (UTM)
zone: 13
datum: nad83_2011
ellipsoid: grs80
north: 3997398
south: 3996851
west: 229377
east: 229975
nsres: 1
ewres: 1
rows: 547
cols: 598
cells: 327106Create a Digital Terrian Model (DTM)
Import lidar data as a vector in GRASS.
gs.run_command('v.in.pdal',
            input='metadata/points2_clean.laz',
            output='lidar_points_be',
            class_filter=2, # Bare earth points
            flags="w",
            overwrite=True)
How many bare earth ppints did we just import?
# Assuming gs.parse_command is already defined and imported
lidar_be_info = gs.read_command('v.info', map='lidar_points_be', format="json")
lidar_be_dict = json.loads(lidar_be_info)
num_be_points = lidar_be_dict["points"]
print(f"We just imported {num_be_points:,} bare earth points")
We just imported 6,631,980 bare earth pointsWe will now interpolate the lidar points into our digital terrain model (DTM).
gs.run_command("v.surf.rst",
               input="lidar_points_be",
               elevation="lidar_be",
               slope="lidar_be_slope",
               aspect="lidar_be_aspect",
               pcurvature="lidar_be_pcurvature",
               tcurvature="lidar_be_tcurvature",
               smooth=0.5,
               tension=40,
               overwrite=True,
               nprocs=24
            )
Visualize the DTM
Interactive Map (Folium)
# Create the shaded relief map
gs.run_command(
    "r.relief",
    input="lidar_be",
    output="hillshade",
    zscale=1,
    overwrite=True,
)

m = gj.InteractiveMap(width="500", tiles="OpenStreetMap", map_backend="folium")
m.add_raster("hillshade", opacity=0.75)
m.add_raster("lidar_be", opacity=0.5)
m.show()
Interactive Map (ipyleaflet)
m = gj.InteractiveMap(width="500", map_backend="ipyleaflet")
m.query_mode = "true"
m.add_raster("hillshade", opacity=0.85)
m.add_raster("points_median", opacity=0.5)
m.add_layer_control()
m.show()
DTM, Slope, and Aspect Figures
DTM 1m Resolution
m = gj.Map()
m.d_shade(color="lidar_be", shade="hillshade")
m.d_legend(raster="lidar_be", at=(5, 9, 50, 90), flags="b", unit="m")
m.d_barscale(at=(5, 6), flags="n")
m.show()
Aspect
gs.run_command("r.colors", map="lidar_be_aspect", color="aspect")
m = gj.Map()
m.d_rast(map="lidar_be_aspect")
m.d_legend(raster="lidar_be_aspect", at=(5, 9, 50, 90), flags="b")
m.d_barscale(at=(5, 7), flags="n")
m.show()
Slope
gs.run_command("r.colors", map="lidar_be_slope", color="sepia", flags="e")
m = gj.Map()
m.d_shade(color="lidar_be_slope", shade="hillshade")
m.d_legend(raster="lidar_be_slope", at=(5, 9, 50, 90), flags="bd")
m.d_barscale(at=(5, 7), flags="n")
m.show()
Calculate Geomorphons
gs.run_command(
        "r.geomorphon",
        elevation="lidar_be",
        forms="geomorphon",
        search=21,
        overwrite=True,
    )

m = gj.Map()
m.d_shade(color="geomorphon", shade="hillshade")
m.d_legend(raster="geomorphon", at=(60, 95, 85, 90), flags="bd")
m.d_barscale(at=(5, 7), flags="n")
m.show()
3D Visualization
elevation_3dmap = gj.Map3D()
# Full list of options m.nviz.image
# https://grass.osgeo.org/grass84/manuals/m.nviz.image.html
elevation_3dmap.render(
    elevation_map="lidar_be",
    color_map="geomorphon",
    zexag=1,
    perspective=20,
    height=4000,
    resolution_fine=1,
    fringe=['nw','ne','sw','se'],
    fringe_elevation=1000,
    arrow_position=[100,50],
)
elevation_3dmap.show()
Stream Extraction
gs.run_command("r.stream.extract", elevation="lidar_be", threshold=500,
                mexp=0.5, stream_length=500, memory=100000, stream_raster="stream_r",
                direction="direction_r", stream_vector="stream_vect")
Let’s view the stream network on the map.
m = gj.InteractiveMap(width="500", map_backend="folium")
m.query_mode = "true"
m.add_raster("hillshade", opacity=0.85)
m.add_raster("points_median", opacity=0.5)
m.add_vector("stream_vect", color="blue", weight=3, type="line")
m.add_layer_control()
m.show()
Overland Flow Simulation
gs.run_command(
    "r.slope.aspect",
    elevation="lidar_be",
    dx="dx",
    dy="dy",
    nprocs=4,
    overwrite=True,
)

OUTPUT_STEP = 2

# Run the simulation
gs.run_command(
        "r.sim.water",
        elevation="lidar_be",
        dx="dx",
        dy="dy",
        rain_value=50,  # mm/hr
        infil_value=0.0,  # mm/hr
        man_value=0.1,
        niterations=10,  # event duration (minutes)
        output_step=OUTPUT_STEP,  # minutes
        depth="depth",  # m
        discharge="disch",  # m3/s
        random_seed=3,
        nprocs=4,
        flags="t",
        overwrite=True,
    )

# Register the output maps into a space time dataset
gs.run_command(
    "t.create",
    output="depth_sum",
    type="strds",
    temporaltype="absolute",
    title="Runoff Depth",
    description="Runoff Depth in [m]",
    overwrite=True,
)

# Get the list of naip maps (bands)
depth_list = gs.read_command(
    "g.list", type="raster", pattern="depth.*", separator="comma"
).strip()

# Register the maps
gs.run_command(
    "t.register",
    input="depth_sum",
    type="raster",
    start="2024-01-01",
    increment=f"{OUTPUT_STEP} minutes",
    maps=depth_list,
    flags="i",
    overwrite=True,
)
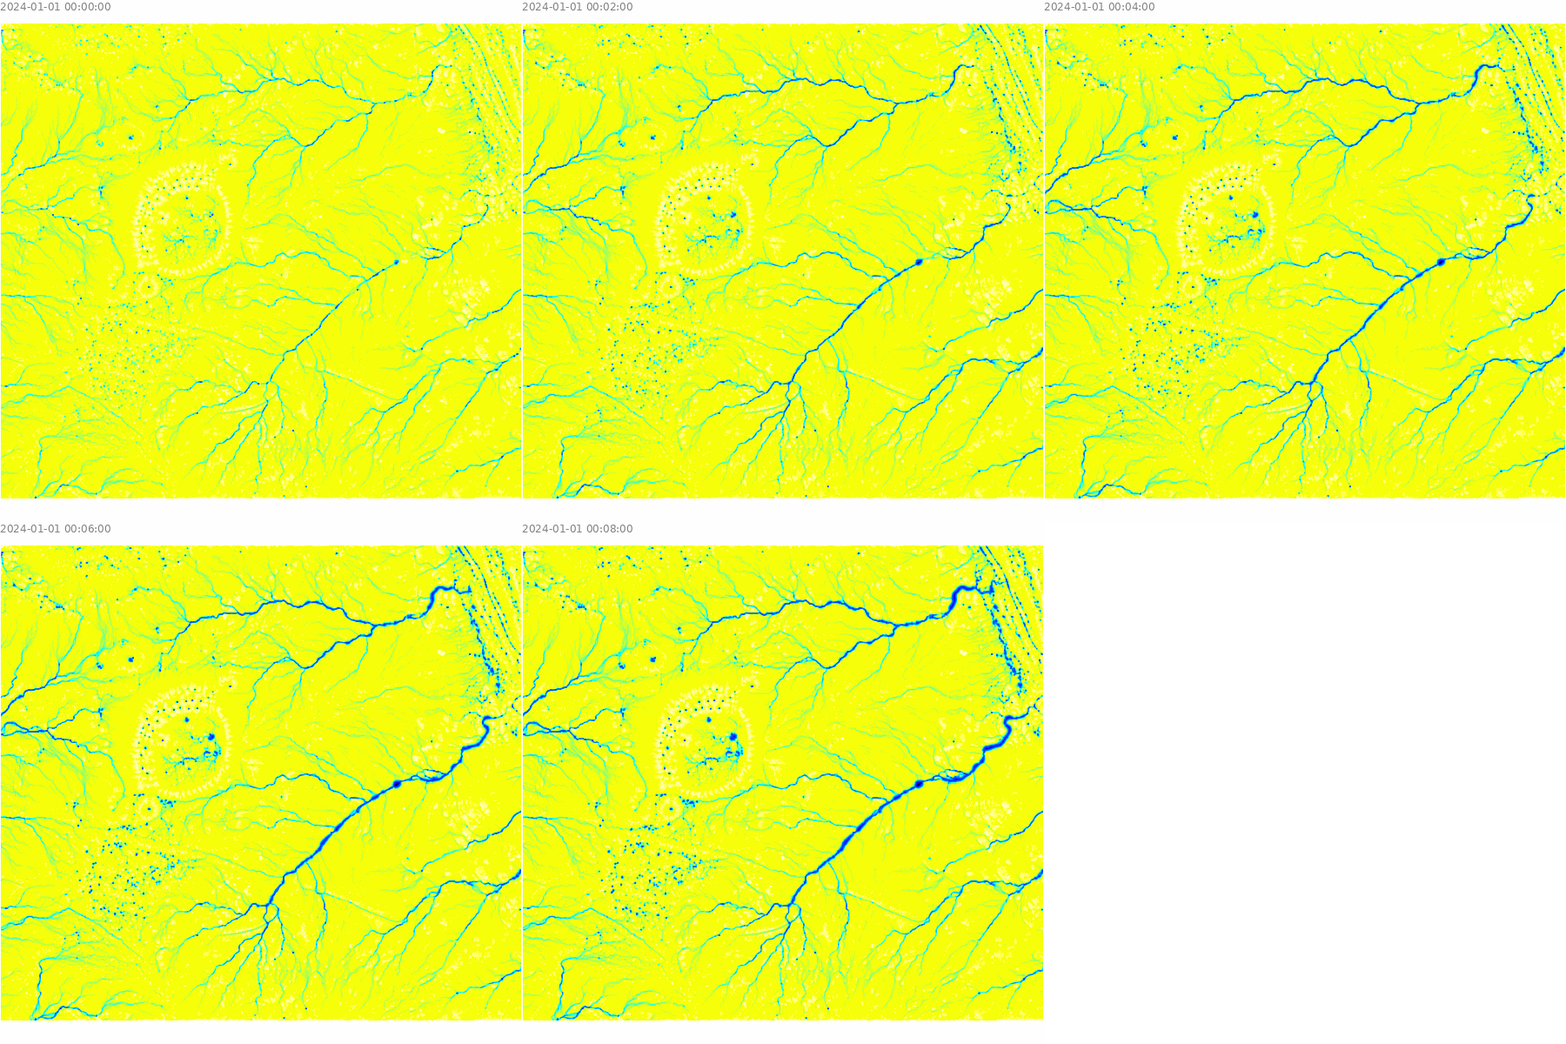
Visualize the results of the overland flow simulation.
m = gj.Map()
m.d_shade(color="depth.10", shade="hillshade")
m.d_legend(raster="depth.10", at=(5, 9, 50, 90), flags="bd", unit="m")
m.d_barscale(at=(5, 7), flags="n")
m.show()
Create Animation from Time Series Data
depth_sum_ts_map = gj.TimeSeriesMap(height=600, width=600, use_region=True)
depth_sum_ts_map.add_raster_series("depth_sum")
depth_sum_ts_map.d_legend()
depth_sum_ts_map.render()
depth_sum_ts_map.save(f"outputs/depth.gif")
depth_sum_ts_map.show()
Export GIF
Select a sample point for analysis
m = gj.InteractiveMap(width=500, map_backend="ipyleaflet")
m.query_mode = "true"
m.add_raster("hillshade", opacity=0.85)
m.add_raster("depth.08", opacity=0.5)
m.add_raster("depth.10", opacity=0.5)
m.add_layer_control()
m.show()
Using our sample point, we can extract the time series data for the point.
gs.parse_command('v.what.strds', input='sample', strds='depth_sum', output="depth_sum_sample")
sample_json = gs.parse_command('v.db.select', map="depth_sum_sample", format="json")
Now we can visualize the time series data for our sample point.
# This is ugly and need to be improved
records = sample_json['records'][0]
del records['cat']
sample_df = pd.DataFrame([records])
transposed = sample_df.T
transposed.columns = ['depth']
sequence = [2, 4, 6, 8, 10]
transposed['time'] = sequence
transposed.set_index('time', inplace=True)
transposed.head()| depth | |
|---|---|
| time | |
| 2 | 0.023435 |
| 4 | 0.027074 |
| 6 | 0.029835 |
| 8 | 0.049045 |
| 10 | 0.317990 |
Create a Time Series Line Plot
# Create a seaborn line plot
import matplotlib.pyplot as plt
transposed.dropna(inplace=True)

plt.figure(figsize=(10, 6))
transposed.plot(kind='line', y='depth', color='blue', marker='o', linestyle='-', linewidth=2)

# Add titles and labels
plt.title('Sample Depth vs. Time')
plt.xlabel('Time (minutes)')
plt.ylabel('Depth (m)')


# Save the plot as an image file
plt.savefig('outputs/line_plot.png')

# Show the plot
plt.show()
<Figure size 1000x600 with 0 Axes>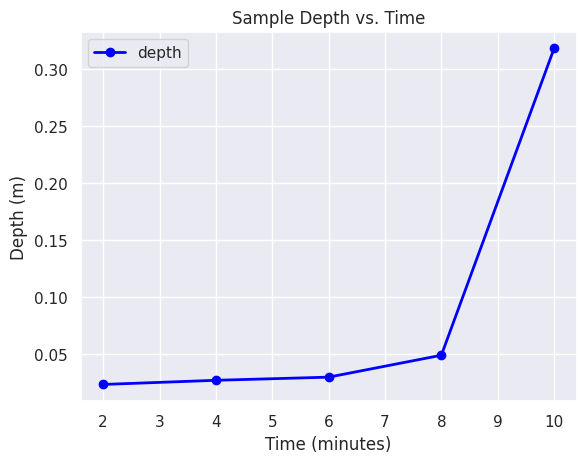
Add the sample point to the map
depth_json = gs.parse_command("t.rast.list", input="depth_sum", format="json")

for i in depth_json['data']:
    map_name = i['name']
    file_name = f"outputs/depth_{map_name.split('.')[-1]}.png"
    print(f"Creating {file_name}")
    i['thumbnail'] = file_name
    depth_map = gj.Map(filename=file_name, use_region=True)
    depth_map.d_shade(color=map_name, shade="hillshade")
    depth_map.d_vect(map="depth_sum_sample", color="red", fill_color="red", type="point", size=12, icon="basic/point")
    depth_map.d_legend(raster=map_name, at=(5, 9, 50, 90), flags="bd", unit="m")
    depth_map.d_barscale(at=(5, 7), flags="n")
    depth_map.show()
Creating outputs/depth_02.png
Creating outputs/depth_04.png
Creating outputs/depth_06.png
Creating outputs/depth_08.png
Creating outputs/depth_10.pngFinal figure
Create our final figure
from PIL import Image

fig = plt.figure(figsize=(25, 30))
ax = fig.add_subplot(2, 2, 1)
ax.set_axis_off()

fig.subplots_adjust(hspace=0, wspace=0.1)

img = Image.open(depth_map.filename)
plt.imshow(img)
ax.set_title("Sampe Point - 10 mintues", {"fontsize": 24, "fontweight": "bold"})

ax = fig.add_subplot(2, 2, 2)
ax.set_axis_off()
img = Image.open("outputs/line_plot.png")
plt.imshow(img)

plt.tight_layout()
plt.savefig("outputs/figure.png", bbox_inches="tight", dpi=300)

plt.show()
STAC Integration
NAIP Data
!t.stac.item url="https://planetarycomputer.microsoft.com/api/stac/v1" collection="naip" datetime="2022" format="plain" method="nearest" extent=region nprocs=2 -dSetting bbox to current region:
BBOX: [-108.00541249, 36.07862566, -107.9985924, 36.08371681]
/home/coreywhite/Documents/GitHub/ncsu-geoforall-lab/tutorials/venv/lib/python3.10/site-packages/pystac_client/item_search.py:678: UserWarning: numberMatched or context.matched not in response
warnings.warn("numberMatched or context.matched not in response")
Search Matched: None items
2 Assets Ready for download...
Downloading assets: 0%| | 0/2 [00:00<?, ?it/s]Downloading Asset: {'href':
'https://naipeuwest.blob.core.windows.net/naip/v002/nm/2022/nm_060cm_2022/36108/m_3610864_ne_12_060_20220525.tif',
'type': 'image/tiff; application=geotiff; profile=cloud-optimized',
'title': 'RGBIR COG tile', 'eo:bands': [{'name': 'Red', 'common_name':
'red'}, {'name': 'Green', 'common_name': 'green'}, {'name': 'Blue',
'common_name': 'blue'}, {'name': 'NIR', 'common_name': 'nir',
'description': 'near-infrared'}], 'roles': ['data'], 'collection_id':
'naip', 'item_id': 'nm_m_3610864_ne_12_060_20220525', 'file_name':
'naip.nm_m_3610864_ne_12_060_20220525.image', 'datetime':
'2022-05-25T16:00:00Z'}
Downloading Asset: {'href':
'https://naipeuwest.blob.core.windows.net/naip/v002/nm/2022/nm_060cm_2022/36107/m_3610757_nw_13_060_20220525.tif',
'type': 'image/tiff; application=geotiff; profile=cloud-optimized',
'title': 'RGBIR COG tile', 'eo:bands': [{'name': 'Red', 'common_name':
'red'}, {'name': 'Green', 'common_name': 'green'}, {'name': 'Blue',
'common_name': 'blue'}, {'name': 'NIR', 'common_name': 'nir',
'description': 'near-infrared'}], 'roles': ['data'], 'collection_id':
'naip', 'item_id': 'nm_m_3610757_nw_13_060_20220525', 'file_name':
'naip.nm_m_3610757_nw_13_060_20220525.image', 'datetime':
'2022-05-25T16:00:00Z'}
Import Url:
/vsicurl/https://naipeuwest.blob.core.windows.net/naip/v002/nm/2022/nm_060cm_2022/36108/m_3610864_ne_12_060_20220525.tif
Import Url:
/vsicurl/https://naipeuwest.blob.core.windows.net/naip/v002/nm/2022/nm_060cm_2022/36107/m_3610757_nw_13_060_20220525.tif
Importing: naip.nm_m_3610864_ne_12_060_20220525.image
Importing: naip.nm_m_3610757_nw_13_060_20220525.image
Downloading assets: 100%|█████████████████████████| 2/2 [00:25<00:00, 12.90s/it]We can view raw data with GRASS using the d_rgb tool.
m = gj.Map()
m.d_rgb(red="naip.nm_m_3610757_nw_13_060_20220525.image.1",
        blue="naip.nm_m_3610757_nw_13_060_20220525.image.3",
        green="naip.nm_m_3610757_nw_13_060_20220525.image.2")
m.d_rgb(red="naip.nm_m_3610864_ne_12_060_20220525.image.1",
        blue="naip.nm_m_3610864_ne_12_060_20220525.image.3",
        green="naip.nm_m_3610864_ne_12_060_20220525.image.2")
m.d_vect(map="stream_vect", color="blue", type="line")

m.show()
Mosaic and Compiste
Let create a mosaic of the NAIP data, and give the bands some names.
def patch_and_composite_naip(year=2022):
    gs.run_command("g.region", res=1)
    naip_bands = [(1, "red"), (2, "green"), (3, "blue"), (4, "nir")]
    for band in naip_bands:
        i, band_name = band
        # Get the list of depth maps
        image_list = gs.read_command(
            "g.list", type="raster", pattern=f"*.image.{i}", separator="comma"
        ).strip()

        gs.run_command(
            "r.patch",
            input=image_list,
            output=f"naip_{year}.{band_name}",
            nprocs=4,
            memory=2100,
            overwrite=True,
        )

    gs.run_command(
        "r.composite",
        red=f"naip_{year}.red",
        green=f"naip_{year}.green",
        blue=f"naip_{year}.blue",
        output=f"naip_{year}_rgb",
        overwrite=True,
    )

patch_and_composite_naip()
Now we can view the naip compsite.
image_map = gj.Map(filename="outputs/naip_2022_rgb.png", use_region=True)
image_map.d_shade(color="naip_2022_rgb", shade="hillshade")
image_map.d_grid(siz=100, color="black", flags="a")
image_map.d_vect(map="depth_sum_sample", color="red", fill_color="red", type="point", size=12, icon="basic/point")
image_map.d_barscale(at=(5, 7), flags="n")
image_map.show()
NDVI
We can use the NAIP data to calculate NDVI.
gs.run_command("i.vi", red="naip_2022.red", nir="naip_2022.nir", output="ndvi", overwrite=True)
ndvi_map = gj.Map(filename="outputs/ndvi.png", height=600, width=600)
ndvi_map.d_shade(color="ndvi", shade="hillshade")
ndvi_map.d_grid(siz=100, color="grey", flags="a")
ndvi_map.d_legend(raster="ndvi", at=(10, 12, 50, 90), flags="bd")
ndvi_map.d_barscale(at=(5, 11), flags="n")
ndvi_map.show()
Let’s create our final figure.
import matplotlib.pyplot as plt
import matplotlib.gridspec as gridspec
from PIL import Image

# Create a figure
fig = plt.figure(figsize=(15, 10))
fig.suptitle('Chaco Canyon 2016 - Overland Flow Simulation', fontsize=24, fontweight='bold')
# Create a GridSpec with 2 rows and 6 columns, making the bottom row larger
grid = gridspec.GridSpec(2, 6, height_ratios=[2, 1])

# Add an image to the left of the plot on the top row
ax_left = fig.add_subplot(grid[0, 1:3])
ax_left.set_title('NAIP 2022', {"fontsize": 18, "fontweight": "bold"})
img_left = Image.open(image_map.filename)
ax_left.imshow(img_left)
ax_left.axis("off")

# Add a larger line graph on the top row spanning the remaining columns
ax_large = fig.add_subplot(grid[0, 3:])
img_large = Image.open("outputs/line_plot.png")
ax_large.imshow(img_large)
# ax_large.set_title('Depth vs. Time', {"fontsize": 18, "fontweight": "bold"})
ax_large.axis("off")

ax = fig.add_subplot(grid[1, 3:4])
ax.set_title(f"Depth Maps", {"fontsize": 16, "fontweight": "bold"})
ax.axis("off")
# Add 5 subplots on the bottom row
for idx, item in enumerate(depth_json['data']):
    ax = fig.add_subplot(grid[1, idx+1])
    map_name = item['name']
    time_stamp = map_name.split('.')[-1]
    img = Image.open(item['thumbnail'])  # Open the image file
    ax.imshow(img)
    ax.set_title(f"{time_stamp} minutes", {"fontsize": 16, "fontweight": "bold"})
    ax.axis("off")

# Adjust layout
plt.tight_layout()

# Show the plot
plt.show()
Funding
Pathways to Enable Open-Source Ecosystems (POSE) Phase II
NSF Award # 2303651
